We always talk about supply and demand, the core KPI which drives the market forces. The more the demand for Bitcoin, the more the price, and hence it is important to understand the Bitcoin metrics.
In the long term, Bitcoin’s scarce is inevitable due to its nature of minting more coins, and hence the price of a Bitcoin will only see upside if you look through a futuristic vision.
This article shall talk about few critical metrics that will help you understand the metrics of demand and supply, holdings, the movement of the price, etc.; all these indicators will help you make the right decision.
Table of contents
- Why are Bitcoin Metrics so important in Crypto Space?
- Transactions on the Bitcoin Network
- Number of Active Addresses on the Bitcoin Network
- Bitcoin’s Adjusted On-chain volume
- Bitcoin Metrics: Miner Revenue
- Bitcoin Metrics: Hashrate
- Bitcoin Miner Revenue Per TH/s
- Average Transaction fee on Bitcoin
- Bitcoin addresses with Balance over $x
- Percentage of Bitcoin Supply Active
- Lightning Network Capacity
- Understanding Bitcoin Metrics: Conclusion
Why are Bitcoin Metrics so important in Crypto Space?
The potential of Bitcoin is enormous; the potential of Blockchain is revolutionary. However, the crypto space is still at its early stage and is very volatile.
Bitcoin is the Big Daddy; its price movement drives the entire market. Therefore, understanding a few important metrics associated with Bitcoin will help us analyze the market better, and we’ll be able to take close to perfect calls.
In general, within crypto, fiat usually flows into Bitcoin; at one point, people start taking profits off the Bitcoin and taking a position in altcoins. The cycle continues, and the rise in Bitcoin’s price shall lift the entire crypto market up.
Transactions on the Bitcoin Network
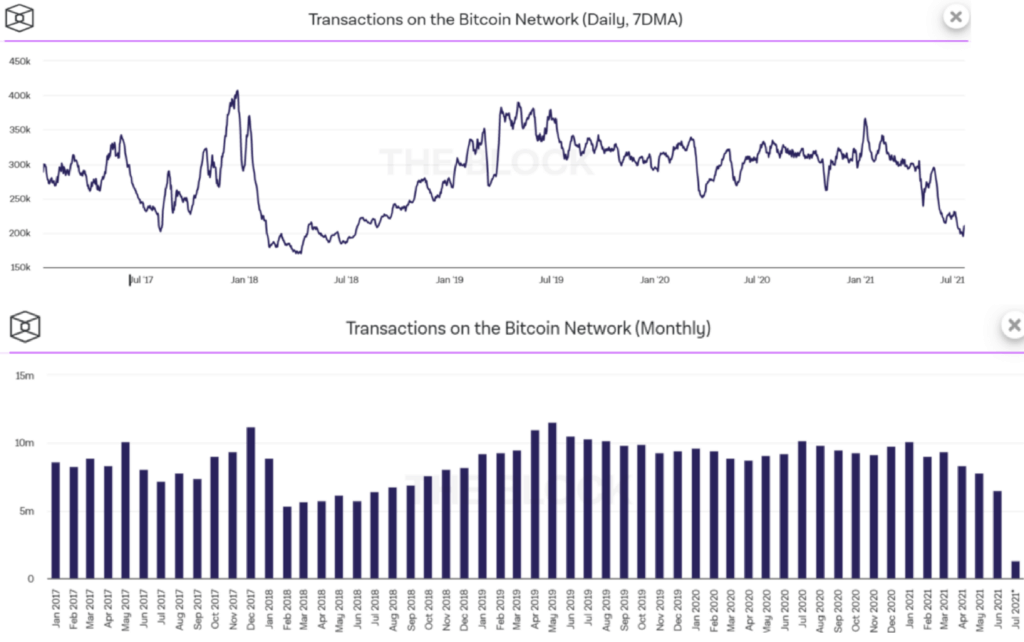
A transaction is a broadcasted and collected block of Bitcoin value. Furthermore, it usually refers to past transaction outputs as new transaction inputs, and all input Bitcoin values are dedicated to new outputs.
Additionally, you can browse and view all the transactions ever collected into a block as none of them are encrypted. Therefore, we can regard transactions as irreversible once they have received enough confirmation.
All transactions are broadcast to the network and, through a process known as mining, are usually validated within 10–20 minutes.

Number of Active Addresses on the Bitcoin Network
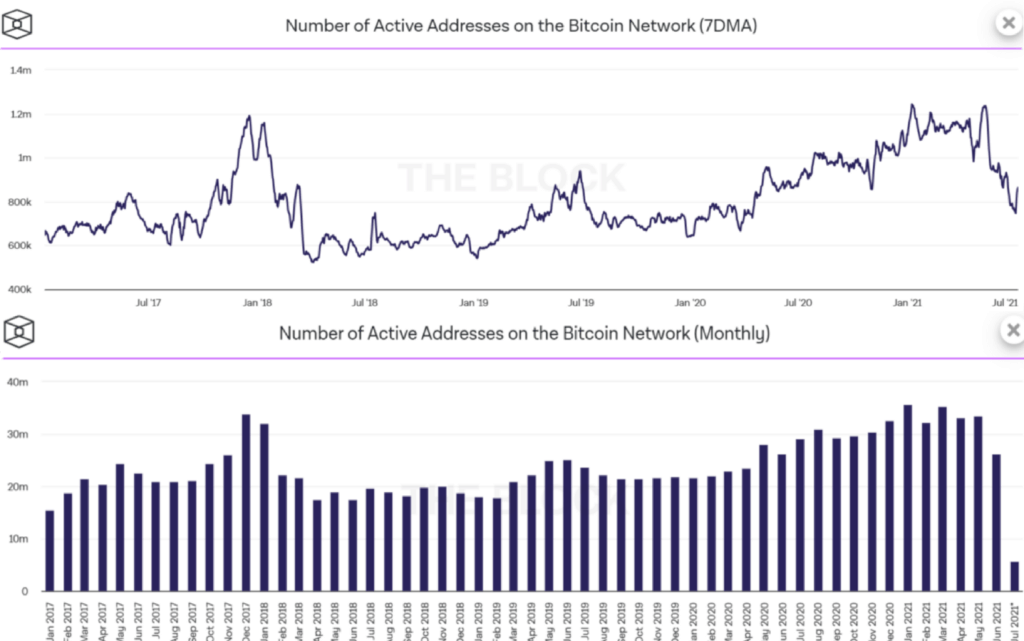
The below charts depict the number of unique addresses that were either senders or receivers in the network. Furthermore, the data only includes active addresses from successful transactions.

Bitcoin’s Adjusted On-chain volume
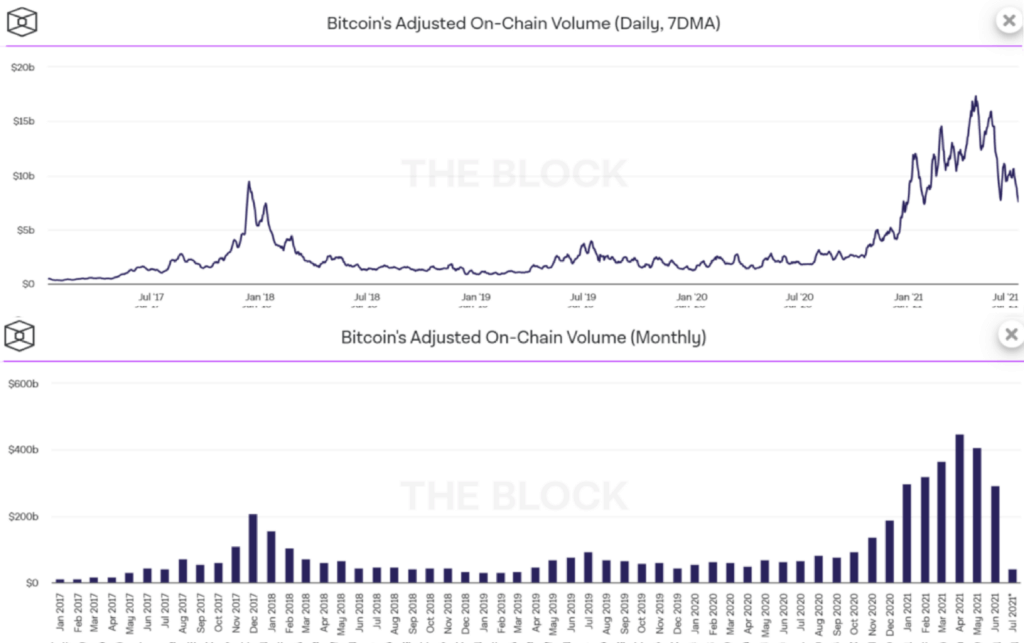
Adjusted transaction volume is a metric for the Bitcoin blockchain’s economic throughput. The change aims to eliminate spam transactions like people transferring BTC back and forth between their own accounts.

Bitcoin Metrics: Miner Revenue
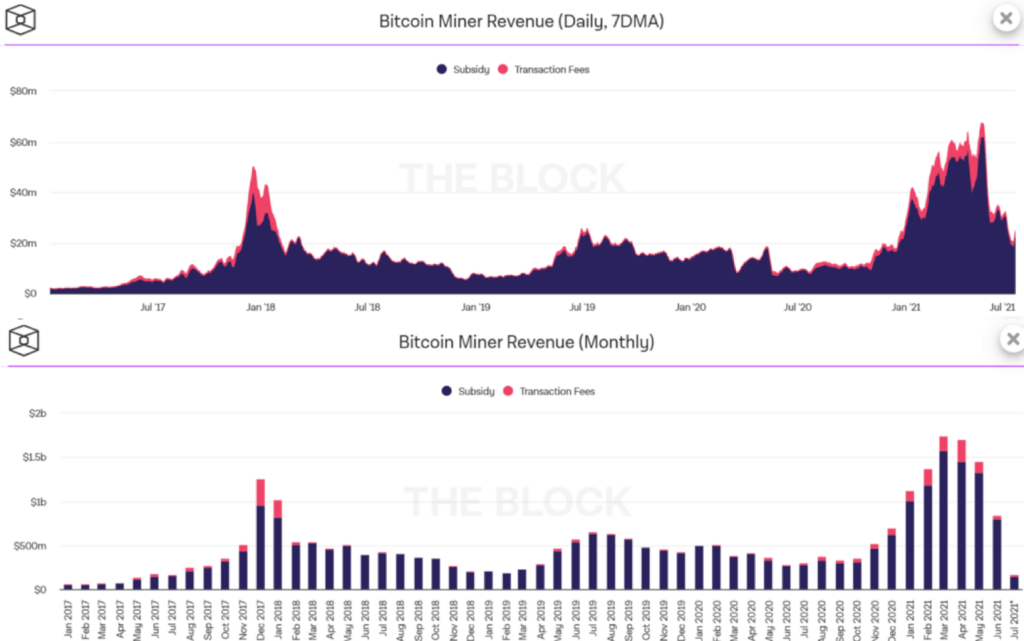
Inflation rewards (block subsidy) and transaction fees are factored into miner earnings. For producing valid blocks and processing transactions, miners are rewarded with the blockchain’s native currency.

Bitcoin’s Transaction Fee % of Total Miner Revenue
The block subsidy on Bitcoin is cut in half every four years. Therefore, miners will be rewarded with fewer inflation incentives. Furthermore, the blocks will have to be secured by transaction fees more frequently.

Bitcoin Metrics: Hashrate
A critical security metric is mining hashrate. The higher the network’s security and general resilience to attack, the more hashing (computing) power it has. Although we don’t know the hashing power of Bitcoin, we can still use the number of blocks mined and the current block difficulty to approximate it.

Bitcoin Metrics: Hashrate by Pool
We can estimate pool Hashrates using data on who mined how many blocks.

Bitcoin Miner Revenue Per TH/s
The TH/s divides the daily miner revenues for the Bitcoin network. This statistic has been trending downward for some time. However, deviations from the trendline suggest more or less profitable periods for miners (due to increasing prices, transaction fees, or favorable difficulty adjustments). The chart is based on a 7-day moving average.

Also, read Top 7 profitable mining pools for beginners.
Average Transaction fee on Bitcoin
The number of transactions on the Bitcoin blockchain is divided by the daily transaction fees. The chart is based on a 7-day moving average.

Bitcoin addresses with Balance over $x
The chart speaks to itself, and it is observable that the number of bitcoin Hodlers is increasing over time.

Percentage of Bitcoin Supply Active
The proportion of the Bitcoin supply that has been active in the last X days.

Lightning Network Capacity
By adding another layer to the Bitcoin blockchain, the Lightning Network seeks to provide an accessible means for users to engage in off-chain payments swiftly and reliably.
Lightning is built on payment channels, letting two parties lock channel money without pressing their transactions to the blockchain.

Each party can send a net value up to the original amount on its side. This graph shows the total balance available for the Channel Capacity throughout all lightning payment channels.
Understanding Bitcoin Metrics: Conclusion
Any technically backed entity/ asset as you may have strong/ decent fundamentals tied to the blueprint. Understanding the technicalities of Bitcoin will help you understand the events happening and foresee the things that might happen due to its cascading effect.
All the data and charts used are taken from The Block.
Author: Eth!c@l Aka Kumar
PS: This is not Financial Advice. Whatever has been documented are the findings from my own research.
Also read


