This week in Markets
Catch the latest happenings of this week. All in one place through CoinCodeCap’s Weekly Glance. We provide you with all the week’s top stuff in crypto for your ease.
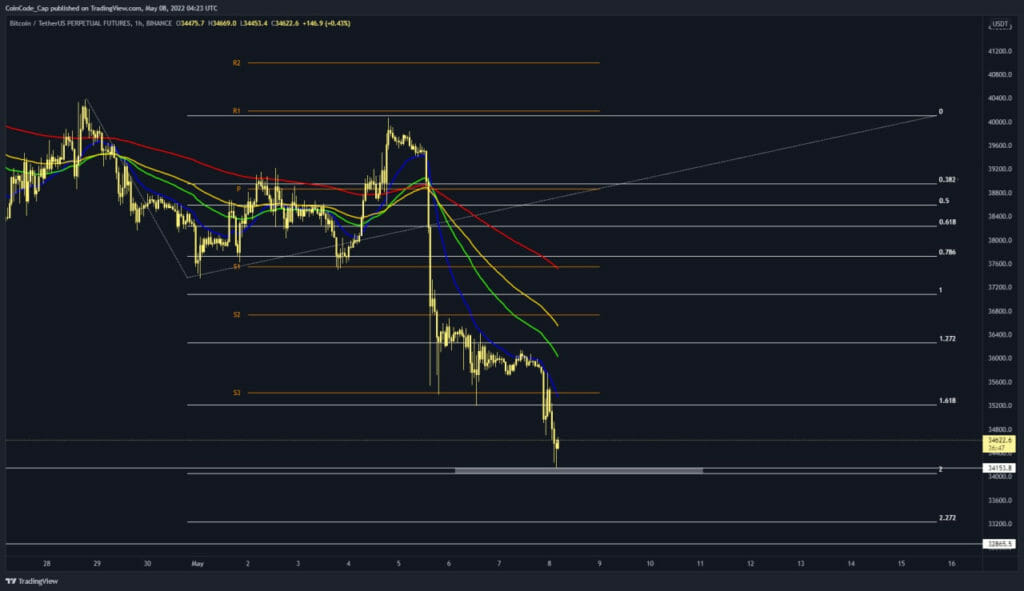
Last week, Bitcoin (BTC) followed a downward trend, anticipating that this week will be no different. On April 30, BTC was trading at a value of $48K and was holding firm when equities closed on Friday. But the jump was a dead-cat bounce, and there has been a massive dump since then. The Bitcoin chart has already made a lower low, which signifies a trend change, and on May 8, it was trading at $34K. After the mid-sized correction on May 6, the dust is still settling across crypto markets.
Bitcoin’s network had 1.17M unique active addresses making transactions on May 6, which was the highest amount of utility since December 2, 2021.

Current Scenario
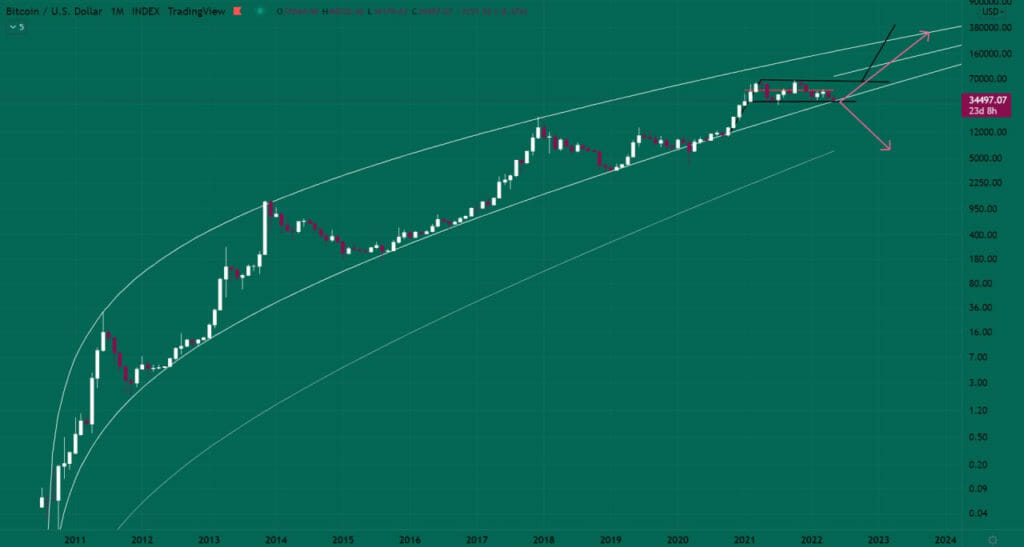
If we deeply analyze $BTC on a higher time frame, i.e., 1Month TF, it could be seen that $BTC is about to retest $33k levels where strong support of Middle Crisis Line of FIB Log is present, which had been respecting PA of $BTC timely.
65% chances exist that after the above-mentioned retest scenario, we’ll witness an upward rally. 35% chances lie which would be worse come worse, upon breaking down of middle crisis line and closure below it would surely lead to the start of a massive bear market & we’ll head lower. ($BTC can take liquidity below the $33k level, too & then resumes an upward rally).

Bull Flag Scenario on 1M TF
If the retest of Middle FIB Log’s Crisis Line goes successful and then $BTC does breakout + closure of BULL FLAG on 1M TF, we are surely going much higher. Keep in mind that this is the financial market; we can’t go upward like a bazooka fire, there will be corrections/pullbacks, but overall $BTC has potential.
What’s Up With The Other Currencies
- On the Ethereum network, there were about 3.4 times as many transactions taken while coins were at a loss compared to in profit on Friday. This was the highest day regarding $ETH’s capitulation trading ratio since Nov 18, 2018, or 3.5 years ago.
- Luna witnessed a -10% candle due to large liquidations in anchor protocol.
- The UST stablecoin lost its peg to the US dollar, which led to panic among traders.
The Weekly Happenings
A sneak peek into this week’s happenings.
- Cloudflare saves Crypto Platform from a Record DDoS Invasion. Find out how it happened.
- Wall Street Giant Goldman Offers Its First Bitcoin-Backed Loan. Learn more about it here.
- South Korean KakaoBank considers Crypto Exchange Partnerships. Read more.
- NFTGo Records the 2nd-Highest Transaction Record in ENS History. Find the details here.
- LBank and Adanian Labs have launched a Crypto Accelerator Program. Here’s all you need to know about it.
- The IMF paid $45 billion to prevent banks in Argentina from using Bitcoin. Here’s why.
- BitMEX Co-Founders to Pay $30 Million in Fines. Here’s what happened.
- Tron Soars Ahead Of USDD Stablecoin Launch surpassing 100 million. Here’s what you need to know
- Central Bank of El Salvador Accepts Qredo’s Registration to Provide Crypto Services. Here’s why.
- Binance has committed $500 Million to Elon Musk’s Buyout of Twitter. Here’s what’s happening.
- The Swiss Regulator has Permitted Dukascopy to Provide Crypto Custody Services. Find out more.
The Charts and Dips
- Top 5 Penny Cryptocurrencies to buy in May 2022: VET, XLM, BAT, CHZ, ZIL [Link]
- NEXO Price Analysis May 2022 [Link]
- Top 3 Crypto to Look Out for in May 2022: APE, LUNA, XRP [Link]
- Crypto to look out for this week: BTC, ETH, GMT, TRX, HT [Link]
- Top 3 Defi Tokens to Buy in May 2022: RUNE, LINK, CAKE [Link]
- ADA Price Analysis May 2022 [Link]
Stolen/Rugged/Scammed/Hacked
- Rari Capital Hacked, Around $80M Lost [Link]
- Rainbow Bridge Attack Averted, Attacker Loses 2.5 ETH [Link]
- Is DeFi Kingdoms a Scam Project? [Link]
- Tezilla Finance Rug Pulled [Link]
- Is NodeGrid a Scam Project? [Link]


