On-Chain and Derivatives:
It is crucial to understand the current regime of the delta between perpetual futures and spot BTC. Prolonged regimes of spot premium paired with trends towards additional spot premium almost always lead to short-term price reversion for Bitcoin.
Over the last week have seen that spot premium push further, especially during the announcement of the Russian invasion into Ukraine Wednesday night EST.
So far, today is another spot premium print despite the mean reversion following yesterday’s short squeeze.
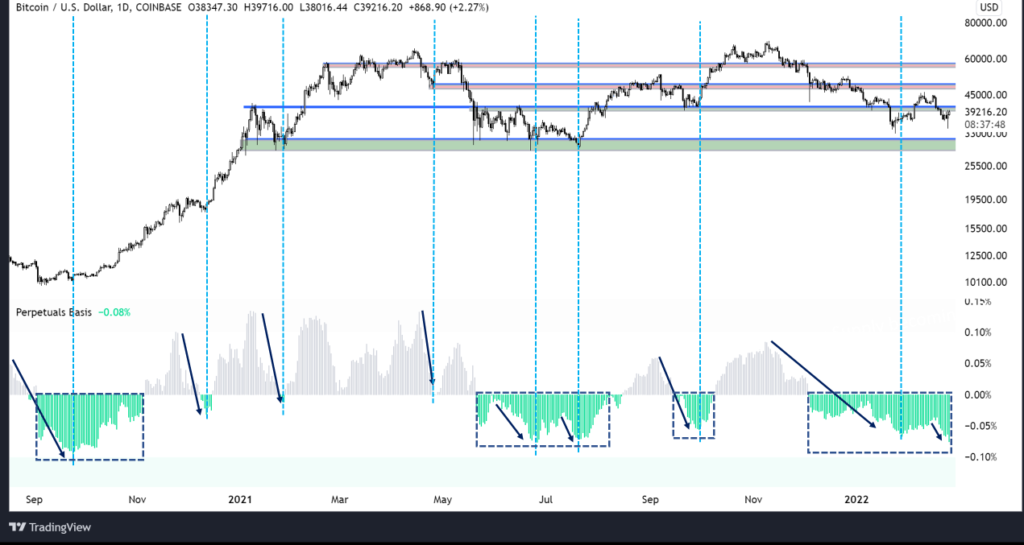
Many of the late shorts that piled in at the lows amidst the Russia panic got squeezed yesterday noon following President Biden’s speech, wiping out a fair bit of open interest.
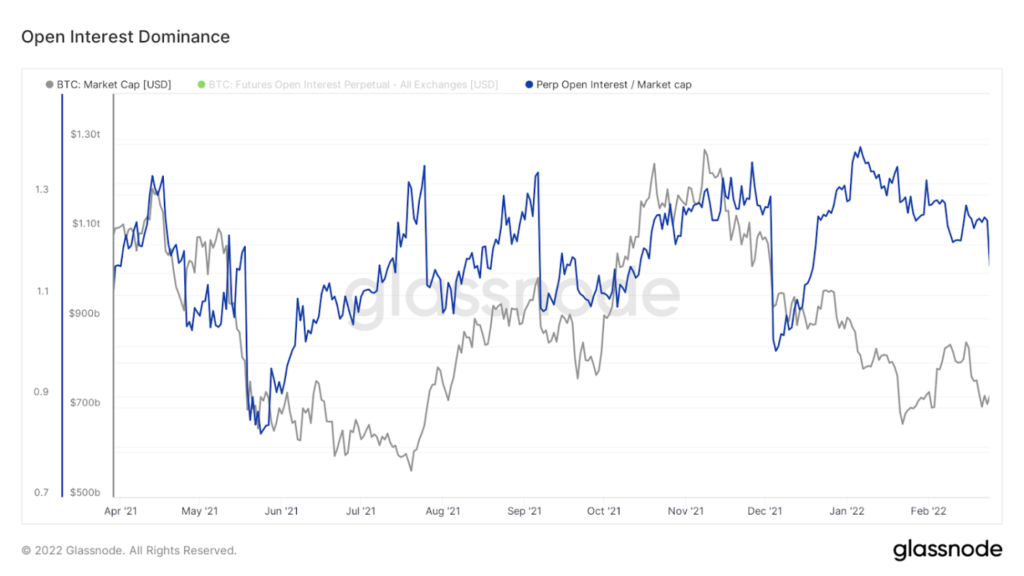
Curious to see if we see a further squeeze upon breaking the critical level of $40.7, but this open interest has been quite strange, as we’ve seen a slow bleed out over the last two months compared to the traditional flush out BTC loves to do.
On-Chain Supply Dynamics:
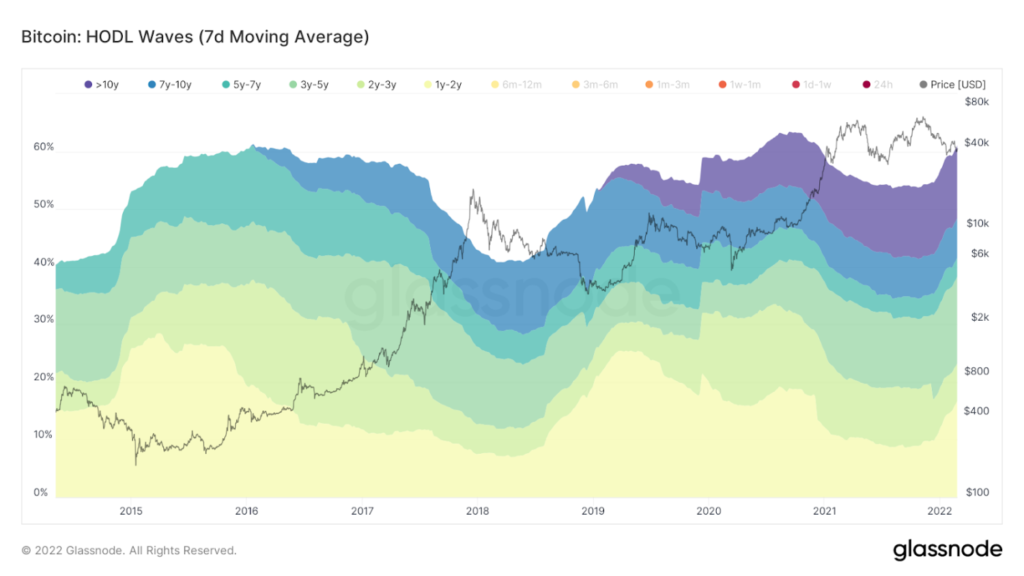
In regard to supply dynamics, one of the main indications of assertive holding behaviour is HODL waves, measuring the amount of BTC supply that has not moved in each denominated cohort of time.
Currently, 76.5% of Bitcoin’s supply hasn’t moved in at least six months, an all-time high.
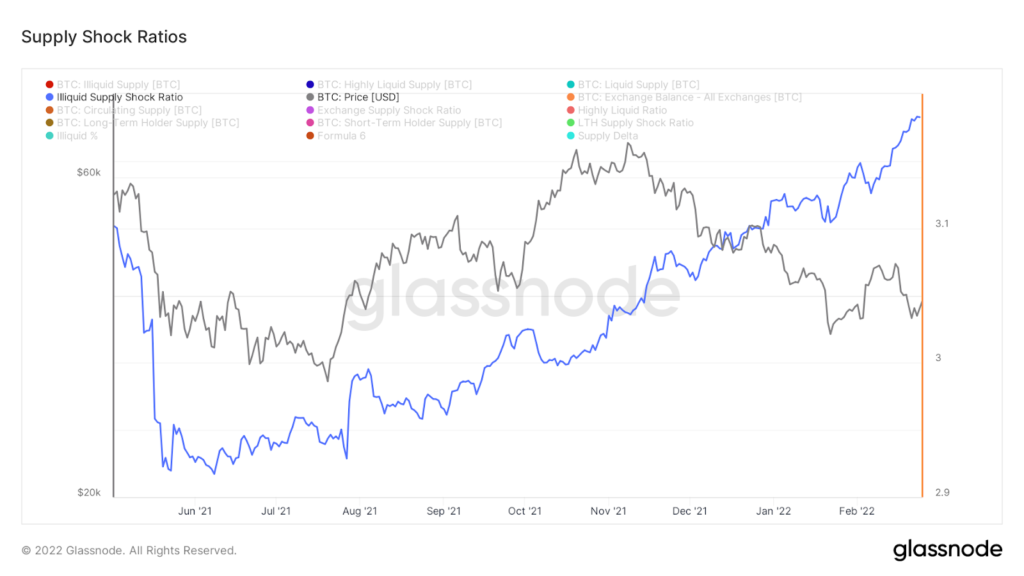
Illiquid supply continues to climb, indicating a flow of supply to entities who hold over 75% of the coins they take in or conversely sell less than 25% of the coins they take in.
76% of supply is currently “illiquid”.
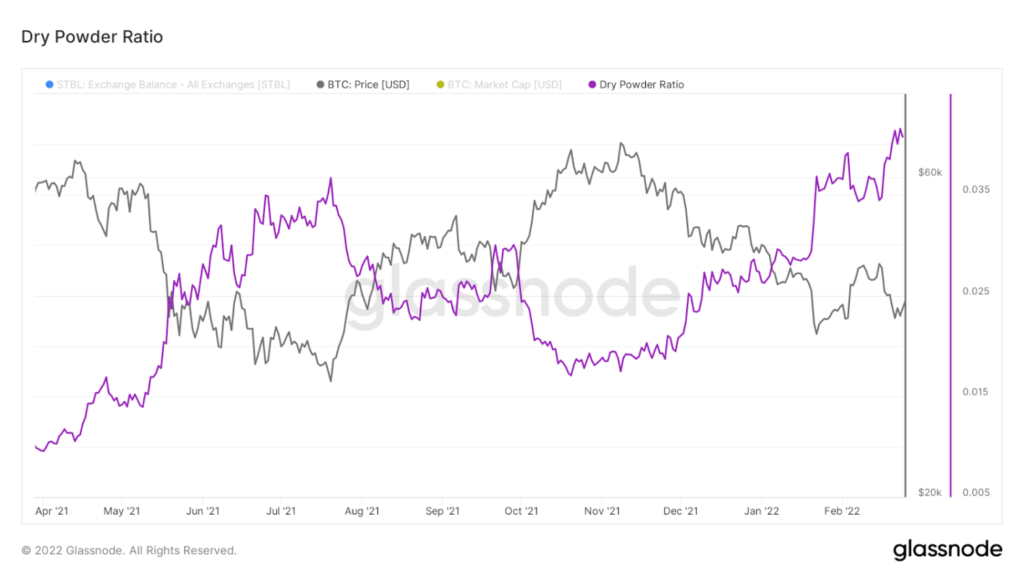
Comparing the value of stablecoins on exchanges to Bitcoin’s market cap.
Significant increases have marked bottoms as dry powder (capital waiting to be deployed) steps into the market.
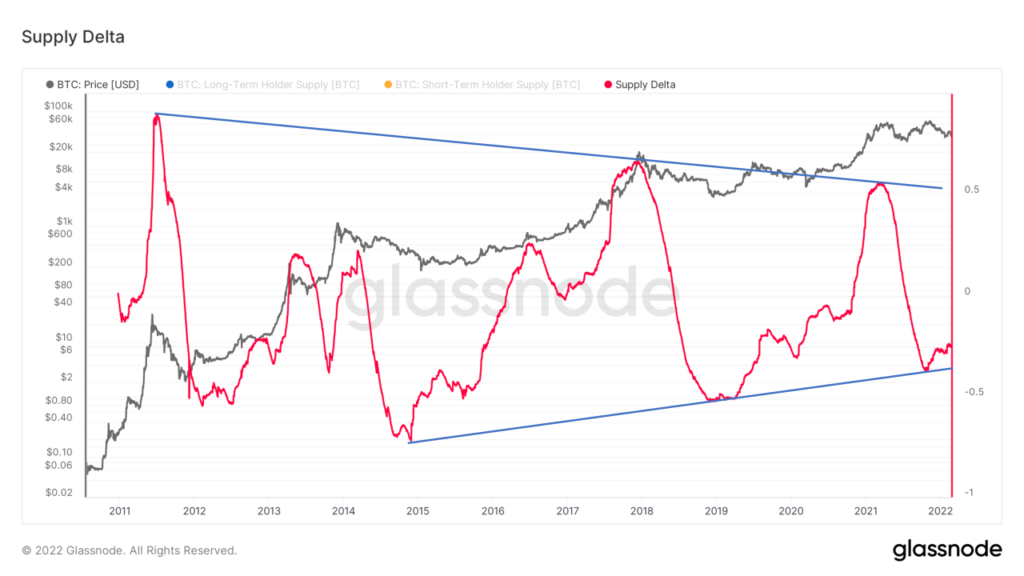
Next, we look at the supply delta. This normalizes long and short-term holder supply and visualizes vital pivot points in their behaviours.
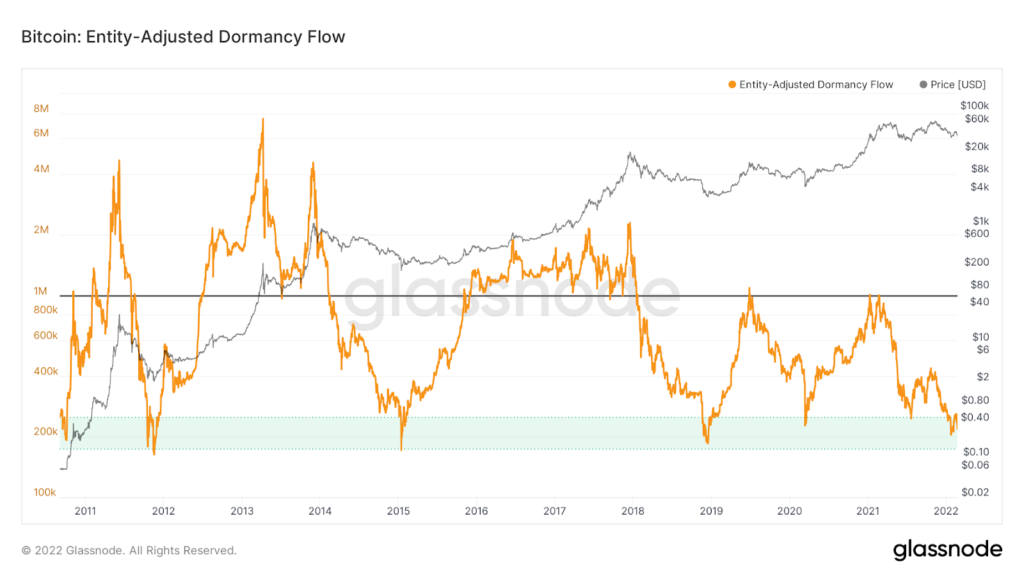
Last, we look at dormancy flow.
This shows that the spending on older coins is lower than the 365-day trend.
This is another indication that these price levels are likely good to the dollar cost average for investors with broader time horizons.
On-Chain Activity:
We’ll look at a few things.
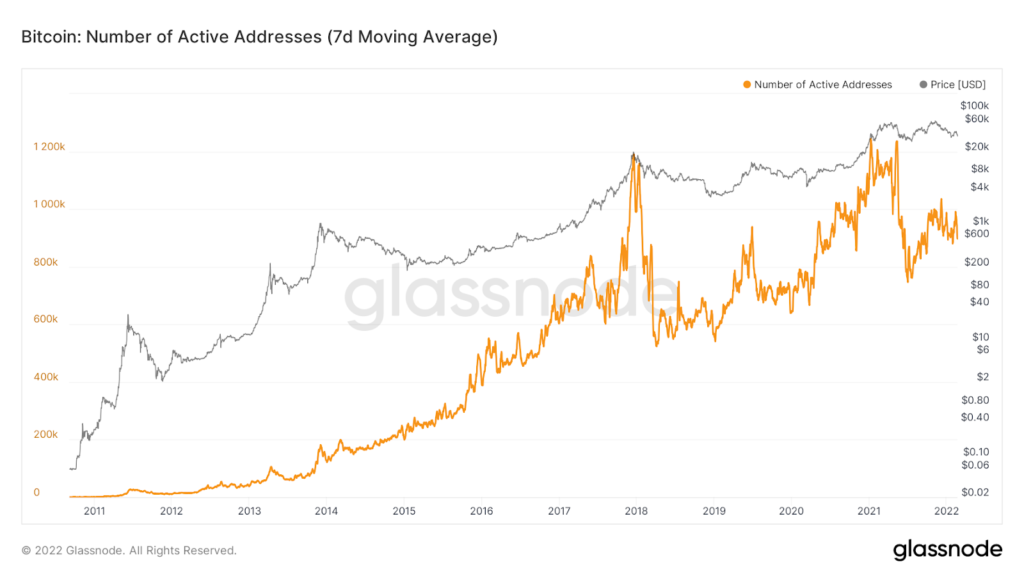
First, we have the active address with a 7-day moving average applied, showing after April 2021, exuberance in Bitcoin never reached the same levels.
Very similar signature in the number of entity adjusted transactions.
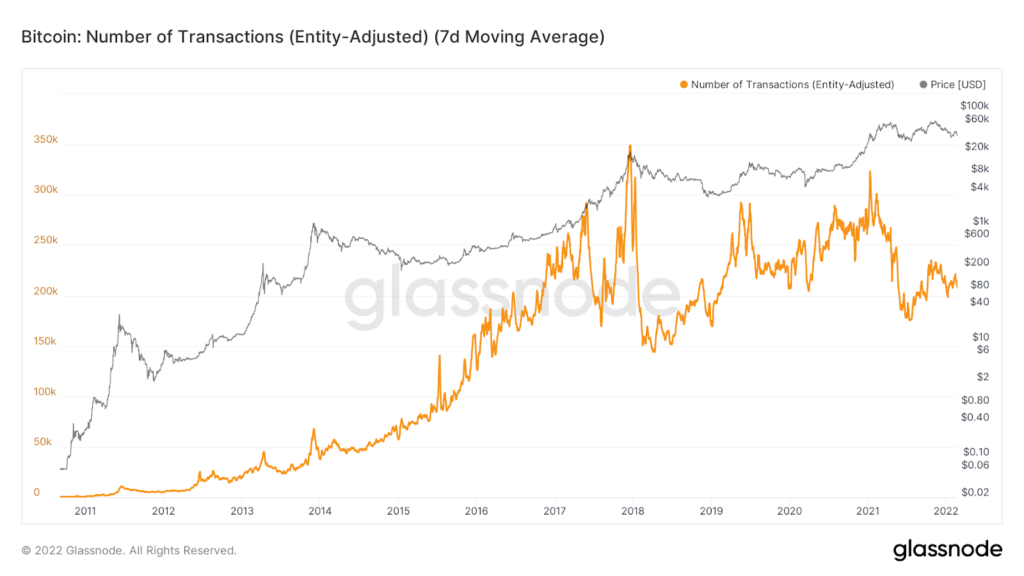
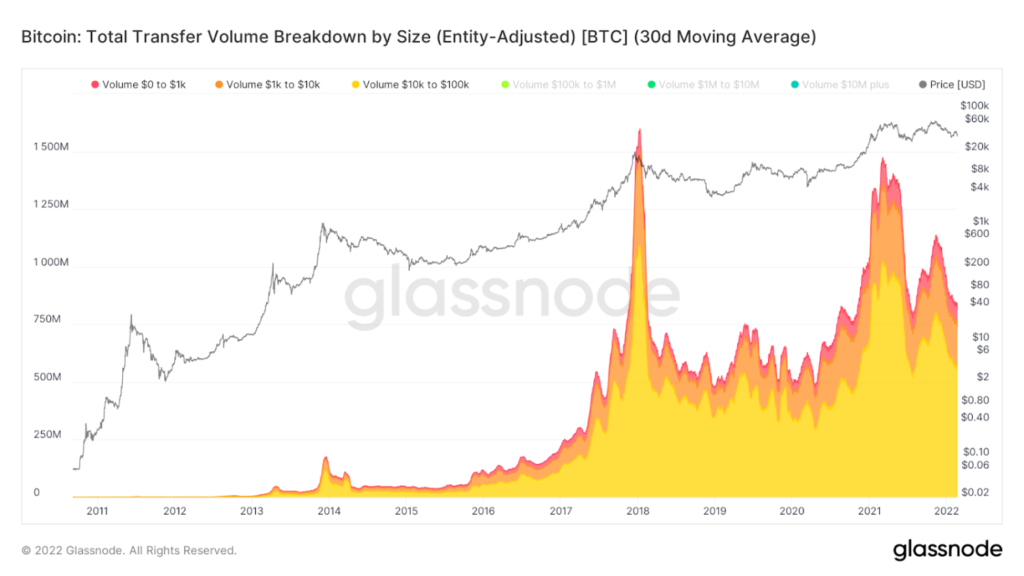
Lastly, confluence with the transfer volume coming from transactions with a USD value of less than $100K. Another indication of lack of retail interest in BTC following April 2021.
Closing Thoughts
The most important part of trading is discipline and patience. So, again, it’s your hard-earned money you’ll be investing, so Do Your Own Research before investing and nothing in this article is financial advice.
Also, read


