The magnitude of a traders’ profit or loss is pinned upon the ability of analysing market trends accurately. Charting tools act as an anchor of decision making for both seasoned and beginners traders, helping tracking trends, price volatility and opportunities in real time. Hence, in this article we are exploring the top 10 Charting Tools for Traders.
Table of Contents
What are charting tools?
Charting tools help traders visualize price shifts of stocks, crypto, forex or other assets. They use graphs like candlesticks and line charts to spot price trends, draw patterns and lines to plan entries and exit and use indicators to make decisions. Basically, online charting tools turn raw market data into easy-to-read visuals so traders can make smarter, faster decisions.
What should you consider while choosing the best charting tool?
Key criteria to evaluate the best charting tools according to your needs are as follows:
- Instrument coverage: Do you need forex, crypto, stocks from many exchanges, futures, options, etc. Some tools are strong in equities but weak in futures, etc.
- Real-time data vs delayed data: Real-time is costlier. If you trade intraday, missing fast moves is risky.
- Backtesting & historical data: How far back does the data go? What resolution (tick / minute / daily)?
- Automation / alerts / signals: Do you need automated pattern detection, bots, alerts on trendline crosses, etc?
- Ease of use vs customization: Beginners may prefer simpler, more guided interfaces; advanced traders will want scripting / custom formulas.
- Security & reliability: Uptime, data quality, security of account credentials, encryption, trusted sources for data.
- Cost & pricing model: Monthly vs annual; free trials; add-ons for data; hidden fees for exchange data; whether cheaper/discounted for “non-professional” users.
- Interface & device support: Web, desktop, mobile; multiple screens; chart layout flexibility; speed.
8 Best Charting Tools for Traders
TradingView
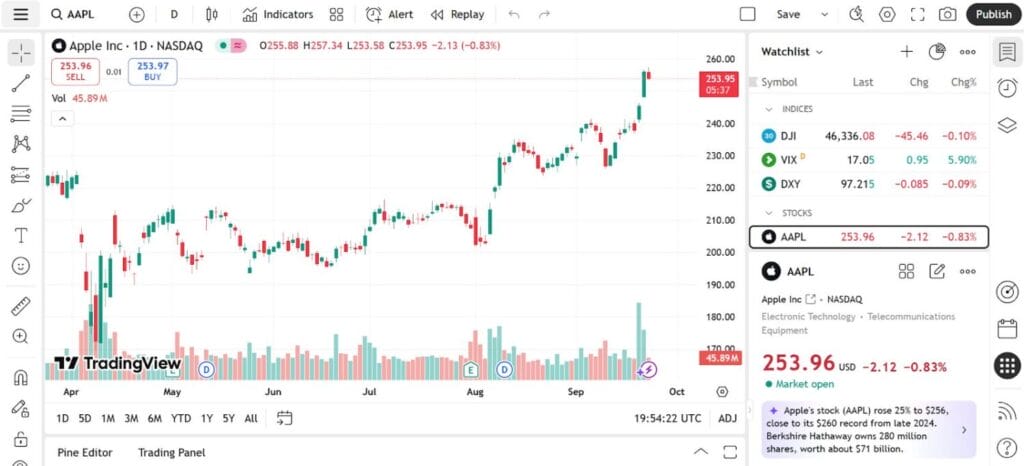
- TradingView covers stocks, forex, crypto, indices, futures, bonds, and ETFs globally, so beginners won’t outgrow it and the best starting points for beginners.
- It offers an exclusive trader community where you can share and publish ideas, follow experts, and copy community-built scripts (Pine Script).
- Furthermore, it provides real-time or delayed data depending on your plan, with the option to buy live feeds from specific exchanges.
- Advanced new features include fundamental graphs like revenue, EPS, and margins, alongside technical charts, helping beginners connect business performance to price action.
- Moreover, TradingView also features news flow, portfolio tracking, and a yield curve tool, so you can track headlines, monitor your trades, and understand macroeconomic shifts all within one platform.
- It supports options analytics (chains, implied volatility, and Greeks) for traders exploring options strategies allowing traders to visualise risk and time decay.
- TradingView’s interface is clean and customizable across web, mobile, and desktop, with multiple chart layouts and alerts via app, email, or SMS.
- Although a free plan is available, TradingView’s paid tiers start at about $12/month (Essential, ₹995) and go up to about $209/month (Ultimate, ₹17,333), with features scaling from 2–16 charts/tab, 5–50 indicators, and up to 1,000 alerts, plus free trials.
Trendspider
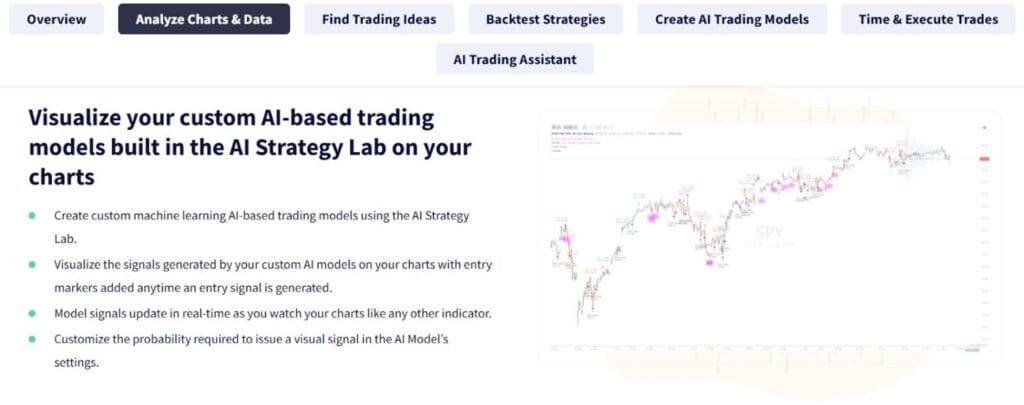
- TrendSpider features an AI trading assistant called Sidekick, which helps traders analyze charts, time trades, and even automate order execution.
- The platform allows you to build custom studies and indicators without needing to code, making it accessible to beginners while still powerful for advanced users.
- It supports timed trades and fully automated order execution, so you can set conditions and let the system handle entries and exits automatically.
- Traders can create custom AI trading strategies and test them in multiple timeframes to see how well they perform before using them live.
- The system is designed so you can train AI-based strategies without needing programming knowledge, lowering the barrier to advanced strategy development.
- TrendSpider also helps you discover new trading ideas and opportunities by scanning markets quickly and accurately to spot inefficiencies.
- Unique features like Raindrop charts and smart alerts make it easier to visualize market activity and get notified when price patterns break or signals appear.
- TrendSpider plans range from $52/month (Standard) to $155/month (Enhanced), all including advanced charting, bots, alerts, AI tools, and training, with capacity (workspaces, bots, alerts, and backtesting depth) scaling across tiers.
3. cTrader
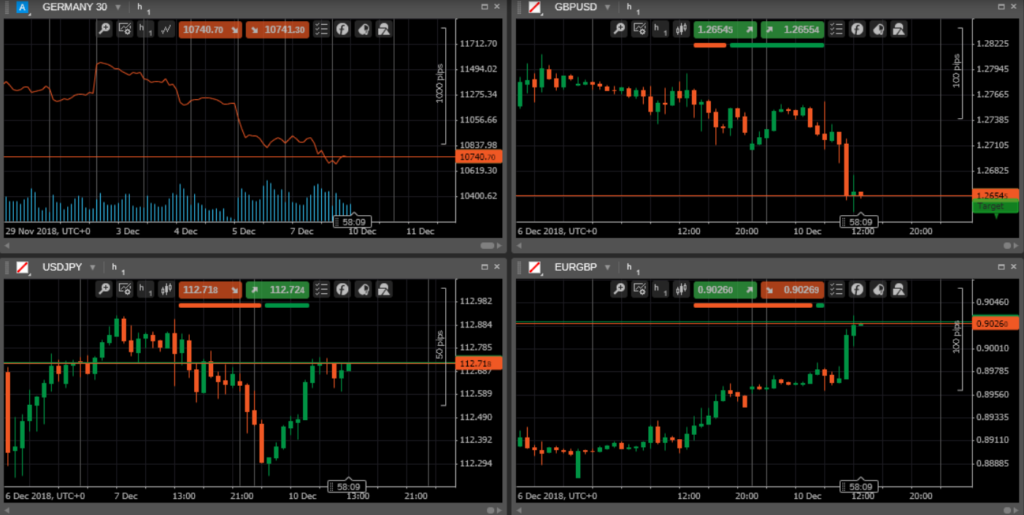
- cTrader is a modern trading platform, designed mainly for forex and CFD traders. It is widely offered by regulated brokers and is known for its clean design, advanced charting tools, and transparency in order execution.
- The platform supports a wide range of instruments including forex pairs, indices, commodities, metals, energies, and cryptocurrencies, depending on the broker’s offerings.
- cTrader provides multiple chart types such as candlestick, bar, line, Heikin Ashi, Renko, and tick charts.
- This platform offers 26 different timeframes ranging from one second to one month. This gives traders flexibility for both short-term scalping and long-term analysis.
- The platform comes with 70+ built-in indicators (like RSI, MACD, and Bollinger Bands) and extensive drawing tools for marking support/resistance, Fibonacci levels, and trendlines. Custom indicators can also be added through cTrader Automate.
- You can open and arrange multiple charts simultaneously, detach them into separate windows, and save personalized layouts to match your trading workflow.
- Using cTrader Automate (formerly cAlgo), traders can create, test, and run custom strategies coded in C#. The platform also supports backtesting with historical data to validate strategies before going live.
- The platform itself is free, but pricing depends on the broker — most charge either spreads or a commission-per-trade model. Many brokers offering cTrader also provide raw spreads with low commissions, appealing to professional traders.
- cTrader Copy Trading fee is a transparent mix of performance (up to 30%), management (up to 10%), and volume fees (up to $10 per million traded), shown upfront before copying.
4. eSignal
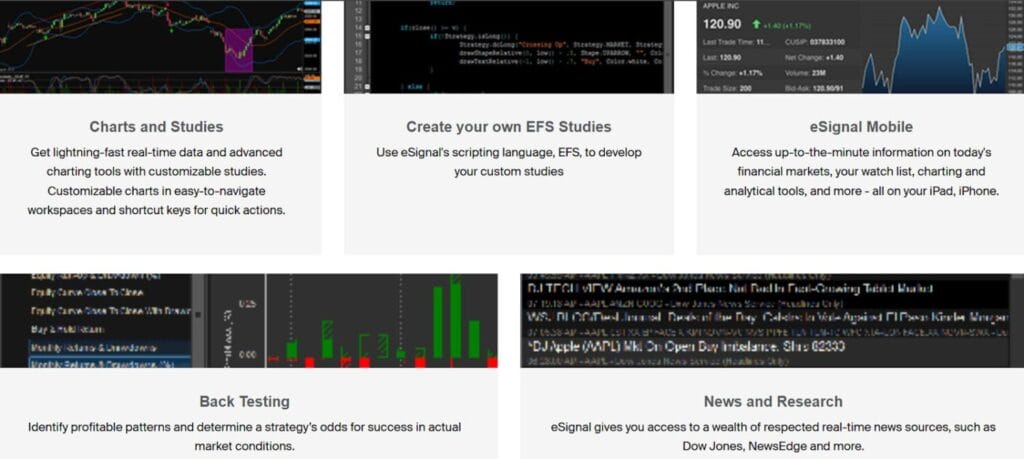
- eSignal is a professional-grade charting platform used by many full-time traders for its deep and reliable market data.
- It provides exclusive exchange feeds and extensive historical tick data, making it one of the most accurate data sources available.
- The platform comes with hundreds of built-in indicators and advanced studies, including tools like market profile and volume profile.
- It allows direct broker integration, meaning traders can place and manage trades directly from the charts.
- Asset coverage is broad, including stocks, futures, forex, and options, which makes it suitable for multi-asset traders.
- The interface is desktop-based and built for professional use, with a steep learning curve but immense customization potential for advanced setups.
- eSignal Plans range from Classic ($57/mo prepaid) with delayed intraday data, to Signature ($173/mo prepaid) with real-time streaming, backtesting, and options, up to Elite ($376/mo prepaid) with advanced GET studies, exclusive indicators, and extended history.
- Performance is exceptional, with minimal latency and strong stability, making it ideal for day traders who rely on fast data execution.
5. GoCharting
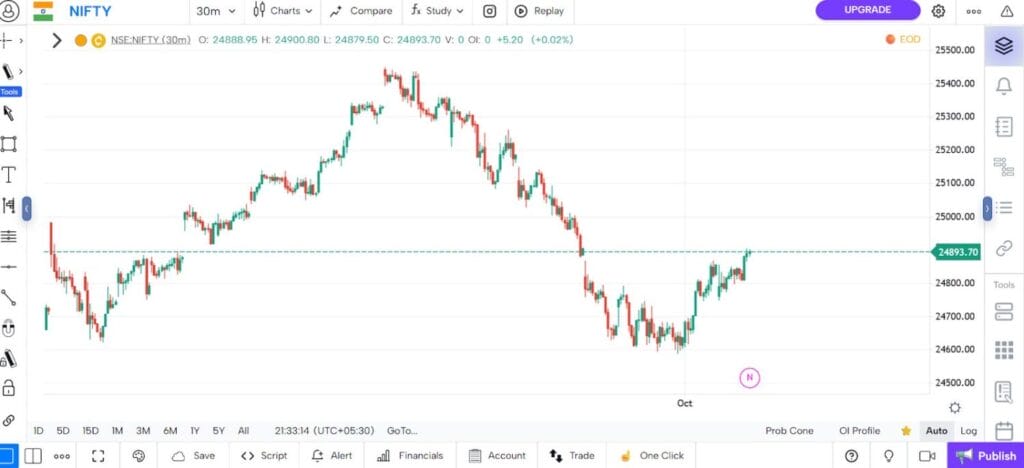
- GoCharting supports 22,000+ trading pairs across 100+ crypto exchanges (Binance, Kraken, Bitfinex, Bitstamp, Poloniex, Bitflyer, and more), so you can chart and trade the majority of liquid markets from one interface.
- Beyond candlesticks, you get Renko, Kagi, Point & Figure, Line Break, Heiken-Ashi, Cluster Imbalance, Range Bars, plus indicator-on-indicator, oscillators, volatility, Fibonacci/Gann, harmonics, trend tools, and layered drawing objects.
- Built-in Footprints/Cluster Charts, Imbalance, Delta/Cumulative Delta, bar statistics, power trades, VWAP/Anchored VWAP and bands give depth on who’s hitting the tape, where absorption occurs, and evolving support/resistance.
- Session, composite, and fixed Volume Profile plus Market Profile (TPO) expose value areas, POC, singles, and auction behavior—ideal for day traders who read distribution rather than just price.
- One-click order entry with hot buttons, drag-to-modify/cancel, mouse-driven modes, and multiple order types (market, limit, stop, TIF). Group and manage positions; switch to paper trading to test ideas safely.
- 100% web-based with drag-resize panels, pop-out windows for multi-screen setups, full-screen themes, cloud-saved layouts/templates, screenshots/social share, Excel export, and a mobile-optimized UI.
- Up to 5 watchlists on Free (more on paid), quick add/delete, color tags, candle screen, multiple views, and portfolio heatmap; manage symbols from context menus or bottom bar; fast symbol lookup.
- Free (50 chart layouts, 10 indicator templates, 5 watchlists). Silver $6/mo (or less annually): 500 layouts, 30 templates, 50 watchlists. Gold $20/mo (or less annually): 1,000 layouts, 100 templates, 500 watchlists.
- Online demo tour, Discord support, hotkeys, context menus, time-zone controls, inverse/dual axes, log/linear/square-root scales, magnet mode—useful touches that speed workflow while keeping charts precise.
6. ProRealTime
- ProRealTime is a professional-grade trading and charting platform widely used in Europe, known for its clean design, reliable data, and strong broker integrations for stocks, futures, forex, and commodities.
- The platform offers highly customizable charts with multiple chart types (candlestick, bar, Heikin Ashi, line, Renko, and more), advanced drawing tools, and the ability to annotate charts extensively. Traders can also use intraday, tick, and range charts for precision.
- The Market replay feature allows traders to replay past market sessions tick-by-tick, making it possible to practice strategies in a simulated environment as if trading live. This is particularly helpful for beginners and strategy testing.
- With ProBacktest, users can create trading systems and run them against historical data. The platform also supports ProOptimizer, which fine-tunes trading parameters to maximize performance before live trading.
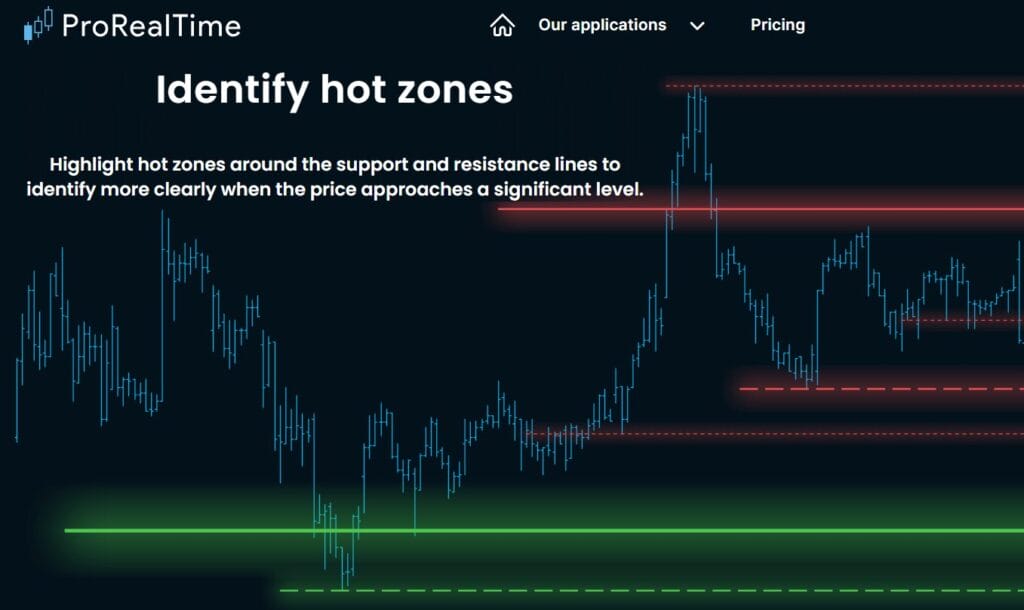
- ProRealTime can automatically plot trendlines, support, and resistance levels on charts, saving time and helping traders spot key technical patterns without manual drawing.
- The platform includes ProScreener, a powerful tool that lets traders build custom market scans using pre-set conditions or their own formulas to filter stocks, forex pairs, or futures contracts.
- In addition to technicals, ProRealTime integrates company financial data and valuations, so traders can analyze fundamentals alongside price action within the same platform.
- The platform is free with delayed data, while real-time subscriptions typically range from $29 to $84/month depending on the market coverage. Performance is strong and reliable, though very heavy use of indicators or scans may require a faster computer.
- The platform is available in both the desktop and mobile versions, widely accessible and affordable.
7. Stock Rover
- Stock Rover is a web-based investment research and charting platform designed for long-term investors, fundamental analysts, and portfolio managers. It combines data-rich research tools with customizable charting, making it a strong alternative.
- The platform focuses on U.S. and Canadian stocks, ETFs, and mutual funds, with 10+ years of historical financial data, analyst estimates, and valuation ratios. However, it does not support forex or futures.
- Stock Rover provides line, bar, and candlestick charts with popular technical indicators such as RSI and MACD, but its strength lies in fundamental charting.
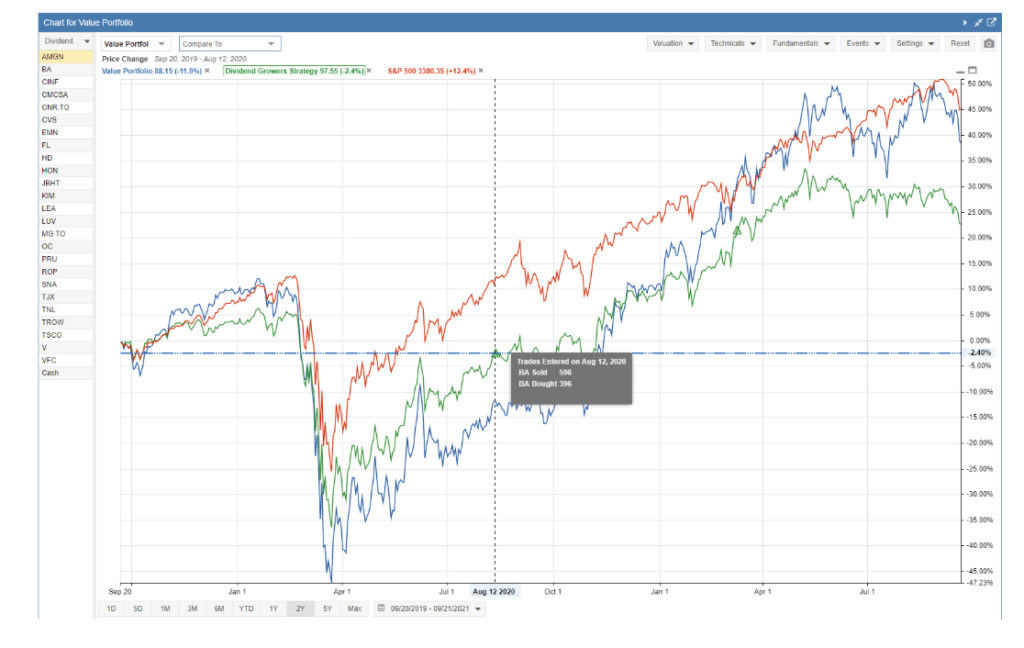
- Investors can overlay metrics like P/E, P/S, dividend yields, margins, revenue, or cash flow directly onto price charts.
- Users can annotate charts, change intervals, switch between indicator styles, and apply data transformations. Premium plans unlock ratio charts, valuation charts, multi-metric charting, and the ability to compare multiple stocks on the same chart for relative performance.
- A unique feature is the ability to create cross-company comparisons directly within charts, making it easy to see how two or more stocks, funds, or ETFs perform against one another across valuation or performance metrics.
- Stock Rover includes one of the most powerful screeners in the retail space, with 650+ financial metrics. You can run custom scans based on fundamentals, dividends, or growth factors and then instantly chart the results for deeper analysis.
- The platform excels at portfolio tracking, rebalancing, and benchmarking. Brokerage integration allows real-time syncing of holdings, while built-in performance reports and income projections help long-term investors manage risk.
- Stock Rover offers a Free plan, Essentials ($7.99/month), Premium ($17.99/month), and Premium Plus ($27.99/month) with advanced charting, metrics, and portfolio tools. A 7-day Premium Plus trial is included, no credit card required.
8. Ycharts
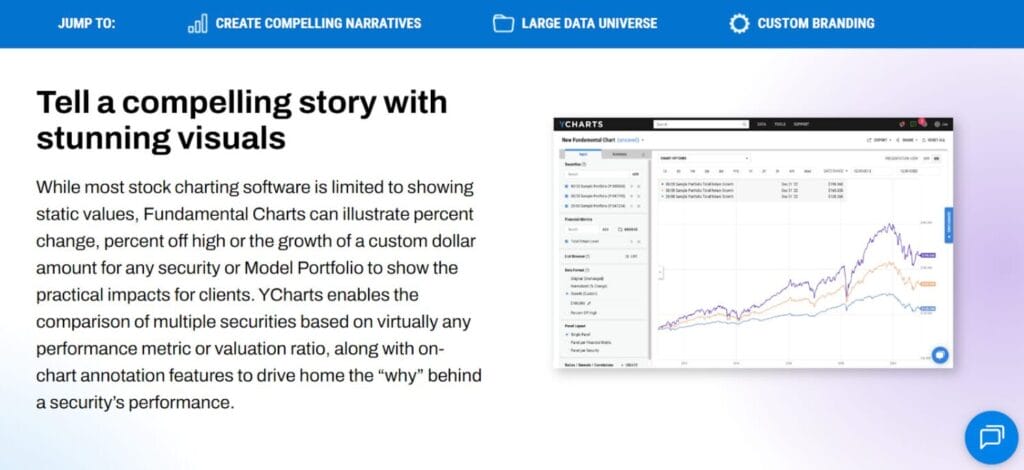
- YCharts is a professional-grade investment research and charting platform that combines market data, powerful visualization, and client-facing tools, making it a go-to platform for professional investment analysis and reporting.
- The platform offers deep coverage of U.S. stocks, ETFs, mutual funds, and macroeconomic indicators, with some international stock support. Its focus on U.S. markets makes it especially strong for professionals managing domestic equity and fund portfolios.
- YCharts is best known for its fundamental and macro charting, allowing users to overlay financial data such as P/E, dividend yield, EPS, and revenue growth on price charts.
- It supports technical charting, scatterplot time-series analysis, relative performance charts, and interval-based comparisons, giving users flexibility in both research and presentation.
- Users can create custom securities, design personalized dashboards, and apply branding to their charts. The platform also allows chart templates and multiple indicator styles, giving analysts full flexibility to tailor visualizations to their workflows.
- With features like Quickflows, YCharts streamlines analysis by letting users run pre-built workflows to screen securities and visualize trends instantly.
- The interactive scatterplot tool helps identify relationships between valuation, fundamentals, and performance across multiple securities at once.
- Advisors can chart risk/return profiles, simulate portfolios, and assess downside scenarios. This makes YCharts not just a charting tool, but also a portfolio planning and risk assessment solution for client-focused professionals.
- The built-in AI Chat assistant helps users find securities, build charts, and generate insights faster. With the Report Builder, professionals can create client-ready, branded reports that combine charts, tables, and commentary in a polished format.
- YCharts pricing is not public, but industry sources estimate $3,600/year for entry-level plans and up to $6,000/year for Professional tiers.
- Charting and advanced features are available starting with the Analyst plan, while the Presenter plan excludes charting.
Best Charting tools – Conclusion
Choosing the right charting platform can make a huge difference in how you approach trading. Beginners should look for platforms that balance ease of use with powerful charting features, while more advanced traders may prefer tools that provide automation, market replay, backtesting, and deep data coverage. At the end of the day, the best charting tool is the one that fits your trading style, markets of interest, and level of experience. Start with free trials, test different features, and choose a platform that grows with you as you develop as a trader.
Frequently Asked Questions
How do I use advanced charting tools for trading?
Advanced charting tools let you go beyond simple price tracking. You can apply technical indicators (like RSI, MACD, or moving averages), use drawing tools (trendlines, Fibonacci retracements), and compare multiple assets on the same chart. Platforms like TradingView, ProRealTime, and NinjaTrader also let you backtest strategies, replay markets, and optimize parameters so you can see how your approach might perform in real conditions. Beginners should start with one or two indicators and simple patterns before exploring automation and custom scans.
What are the top charting tools for commodity trading?
For commodities like gold, oil, or agricultural futures, platforms that support futures markets and provide strong charting tools are ideal. NinjaTrader, ProRealTime, and MT5 are among the best choices for commodity traders, offering market depth, backtesting, and advanced indicators. TradingView also covers commodities globally with easy-to-use charts and custom alerts.
What are the best online charting tools?
If you want a tool that runs smoothly in your browser without heavy downloads, TradingView, Koyfin, and StockCharts.com are excellent online charting platforms. They are web-based, intuitive, and accessible across devices, making them convenient for traders who want to monitor markets anywhere.


