Table of Contents
What is statistical analysis? Why are various tools used for the same?
To find patterns, trends, and relationships in data, statistical analysis includes gathering, examining, summarizing, and interpreting the data. To extract valuable insights from data, it makes use of a variety of techniques, including regression analysis, data analysis, hypothesis testing, and correlation analysis. These resources support the process of forecasting future results, comprehending the relevance of discoveries, and making well-informed decisions. Furthermore, statistical analysis offers a systematic framework for data analysis in a variety of domains, including science, economics, medicine, and the social sciences. It also helps in error identification and uncertainty reduction. Here, in this article we will explore the best statistical tools for data analysis.
Best statistical analysis tools to use
1. IBM SPSS statistics
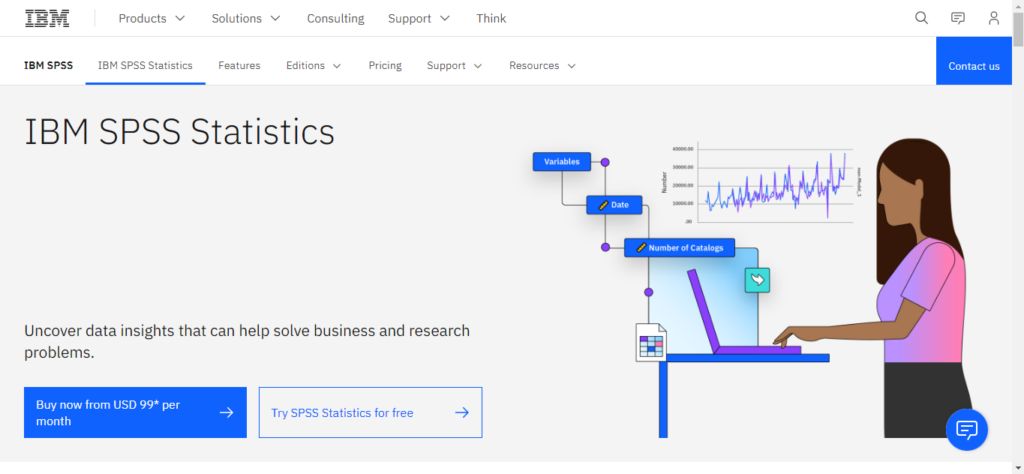
IBM SPSS Statistics software comes in handy to tackle business problems that are unique to their industries and promote high-quality decision-making. Sophisticated statistical techniques and visualization can offer a reliable, intuitive, and comprehensive platform for comprehending your data and resolving challenging business and research issues. It’s mostly used by statisticians for research on data where a report or model has details. It is a user-friendly and GUI-based process.
Pros:
- One of the best features of IBM SPSS Statistics is its user-friendly interface, which makes it easy for users to analyze data and generate insights without extensive programming knowledge.
- It integrates easily with other software and applications like Snap Surveys, Prosper, etc.
- The software can be used frequently due to its easy implementation and data-analytical approach integration.
Cons:
- The subscription is costly and hard to afford for students of the Asian subcontinent.
- It cannot identify data types accurately.
- Working on large data sets might buffer the system, making it hard to obtain results.
Pricing:
The pricing plans for the software start at $99.00.
Also, you may read 5 must read popular econometrics books
2. MatLab
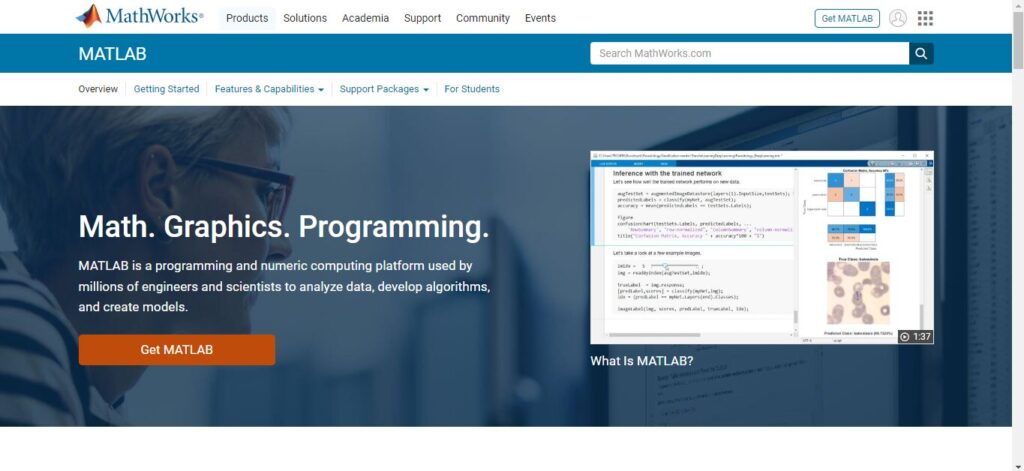
MatLab is beginner-friendly and easy-to-use software that enables its users to perform complex statistical analysis without the need for any prior knowledge. The team at MAtLab has created software that is the god for every engineer, rather for any field of engineering. The codes available at the repository are just so easy to locate, and if you are stuck at some point, the forums are at your doorstep to help.
Pros:
- MATLAB has an add-on or library for almost every field of technology, ranging from simple vector calculations to tensors.
- Its syntax is designed to be intuitive and user-friendly, making it accessible to beginners and experts alike.
- It natively supports a wide range of complex mathematical operations like numerical optimization, matrix manipulation, and handling tensors of higher orders.
Cons:
- Problems like inverse kinematics in robotics take time to compute.
- The serial communication packages also take strain while integrating.
- The pricing is a bit too much for a student who is already spending too much on their studies.
Pricing:
The pricing plans for the platform start at 74,000 INR per year.
3. Eviews
EViews offers a comprehensive set of econometric tools and techniques, allowing users to perform various statistical analyses, time series modeling, forecasting, and data manipulation tasks. It has a very clean UI, which helps the user maximize the utility as per his or her needs. There are many new features available on the platform, and it is always up to the new methods and standards.
Pros:
- It’s a very handy tool for econometric analysis, specifically time series analysis.
- The interface is very friendly, and it’s easy to understand.
- It does not require much programming knowledge as everything is clearly specified with clear options.
- The tool is efficient on low-spec computers, so there is no need for the latest generation of specs.
Cons:
- While EViews has a user-friendly interface, mastering its more advanced features and programming language can require time and effort.
- One has to rely on other software if they need to visualize the data better and get various graphs and plots with results.
Pricing:
The pricing plans for the platform start at $1650 per user per year.
Also, you may read Top 5 Best Web Scraping Tools
4. Tableau
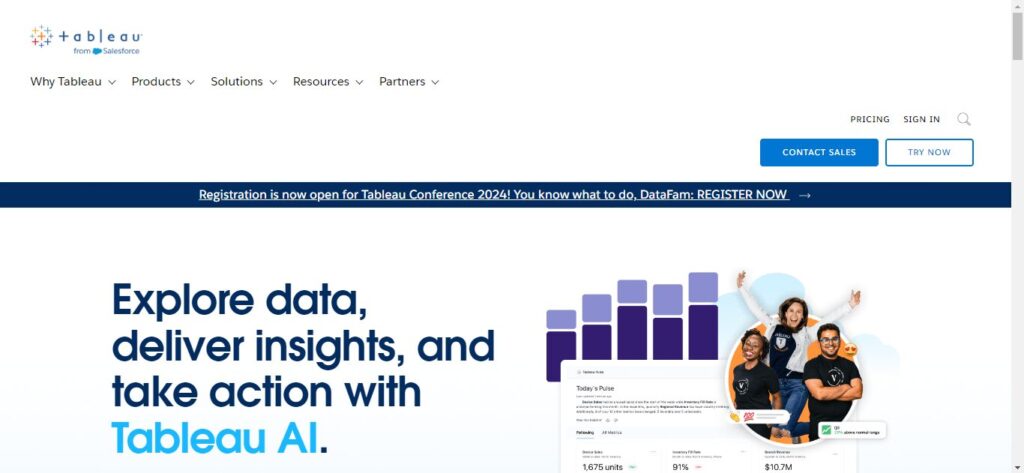
Tableau is an extremely good and easy-to-use tool for getting insights about sophisticated data. It is the most widely used tool nowadays because of its user-friendly interface and mind-blowing features, which help you understand your data in a variety of ways. It also has various rigorous security features that protect your data at all times.
Pros:
- Tableau is extremely good and easy to use for getting insights about the data.
- Prompt responses from support staff during outages and assurances of help are commendable.
- Its availability in the mobile version really helps you check and track your team’s progress on the go.
Cons:
- Tableau is one of the most expensive BI tools among all others available on the market currently.
- When working with large datasets, it takes a lot of time to extract data when trying to analyze raw data.
- Tableau’s advanced features may require some time and effort.
Pricing:
The creator plan for the platform starts at $70 per user per month.
5. Stata
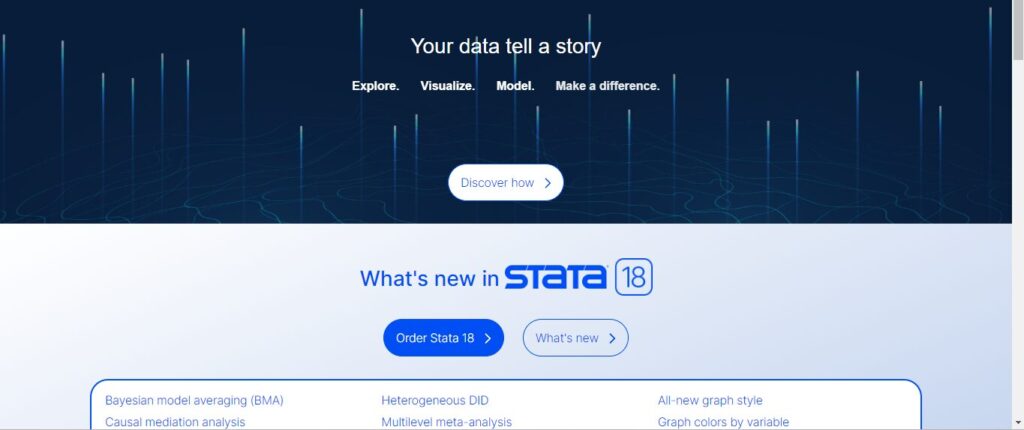
Stata is a widely adopted statistical software that offers numerous benefits for academic research and collaboration. One of its most substantial advantages is its extensive usage within the academic community. This prevalence ensures that many researchers and scholars are familiar with Stata, making collaborating and exchanging knowledge with colleagues easier. The ability to seamlessly work with others using Stata enhances the efficiency and effectiveness of academic projects.
Pros:
- It easily creates graphs and other visualizations to help explain the statistical results.
- Stata makes it easy to document and produce statistical data analyses. It’s especially best for academic research.
- The data can be easily imported and exported in various formats.
- It is very intuitive and has a lot of great libraries for any number of statistical analyses.
Cons:
- It’s a bit on the expensive side and comes with somewhat of a learning curve.
- There isn’t a lot of help available online compared to, say, SPSS when you need it.
Pricing:
The pricing plans for the platform start at $765.
Also, you may read Best Data Visualization Tools To Use – important
Conclusion
In conclusion, the type of data, the goals of the study, and the level of user experience all play a role in choosing the optimal statistical analysis tool. While commercial programs like SAS and SPSS offer substantial support and user-friendly interfaces, tools like R and Python with libraries like Pandas and SciPy offer a great deal of power and flexibility. In the end, researchers should assess their individual requirements and preferences in order to select the tool that best fits their workflow and analytical needs.
Frequently Asked Questions
Is data analysis the same as statistical analysis?
Although they are similar, statistical analysis and data analysis are not the same. To extract insights, data analysis entails evaluating, purifying, and manipulating data. The main goal of statistical analysis is to examine data, test hypotheses, and draw conclusions using statistical techniques. A subset of data analysis, which includes a wider range of methods and strategies, is statistical analysis.
What are two freely available statistical tools?
R and Python are two open-source statistical programs that come with libraries like NumPy, SciPy, and Pandas. R is a robust statistical programming language that comes with an extensive library of tools for data visualization and analysis. Python is a flexible option for data scientists since it provides comparable capabilities with packages that facilitate statistical analysis.


