One of the most popular elements that assist in making informed decisions in today’s data-driven world is visual analytics. Data visualization tools transform raw data into an effective, efficient and visually appealing format that help small as well as large businesses to make rational decisions for their fruitful growth. Before moving forward, let us try to understand what data visualization is and how it helps businesses.
Table of Contents
What is data visualization?
Data visualization is the graphical depiction of data using maps, graphs, and charts to highlight trends and draw valuable insights. It simplifies complex datasets and makes them easier to comprehend and analyze. Through facilitating data analysis, it improves decision-making and communication in a variety of sectors.
What are data visualization tools and why are they important?
Data visualization tools are platforms that make it easier to transform raw data into visually appealing and educational presentations by allowing users to create interactive dashboards, reports, and charts. Some of the most common visualization techniques include pie charts, bar graphs, infographics, histograms, scatter plots, etc.
These tools offer a large number of useful features like interpreting large information sets by converting them into an easily understandable format, efficient communication of data-driven insights, revealing trends, correlations, and patterns, and upscaling accessibility to a broader audience.
Let’s now take a look at five best data visualization tools that can help you present your data in the most efficient way possible.
Top 5 data visualization tools
1. Google Charts
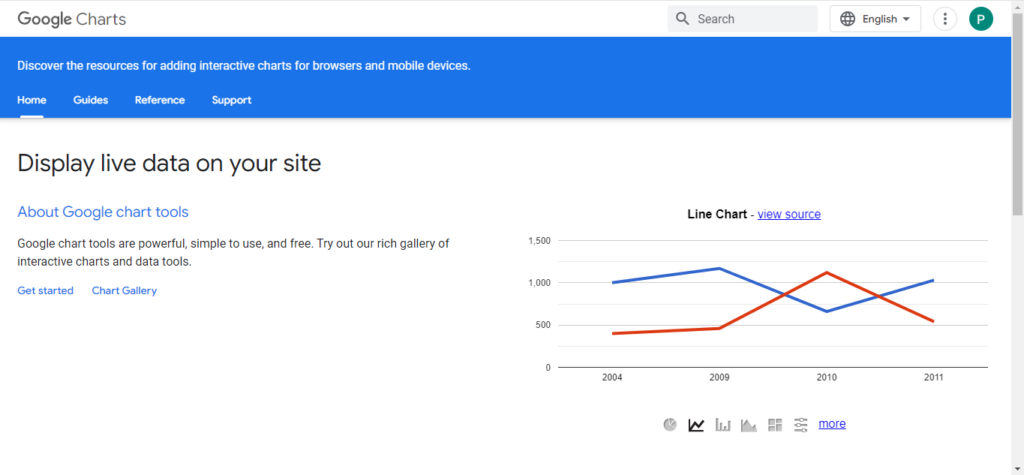
Google Charts is an excellent statistical software which lets you visualize and represent your data in a presentable form. It helps you provide graphics for intra-company presentations, where data can be quickly assembled and graphed in order to shed light on trends, ideas, or capabilities pertaining to opinions or data.
Features:
- One of the best things about google charts library is its simple usage and huge community which helpsin fixing issues a variety of issues.
- The UI of charts is very modern and looks good on dashboards.
- It is easy to access from any device in the world as it is saved on Google’s cloud.
- It is free and still manages to outperform almost all its rival products.
- The easy to use API and implementation, along with the fact that users also have an easy time reading the charts are big pluses.
Pricing:
- Google charts is completely free to use and guarantees three years’ backward compatibility.
Also, you may read Top 5 Econometrics Software- Important Read!!
2. Tableau
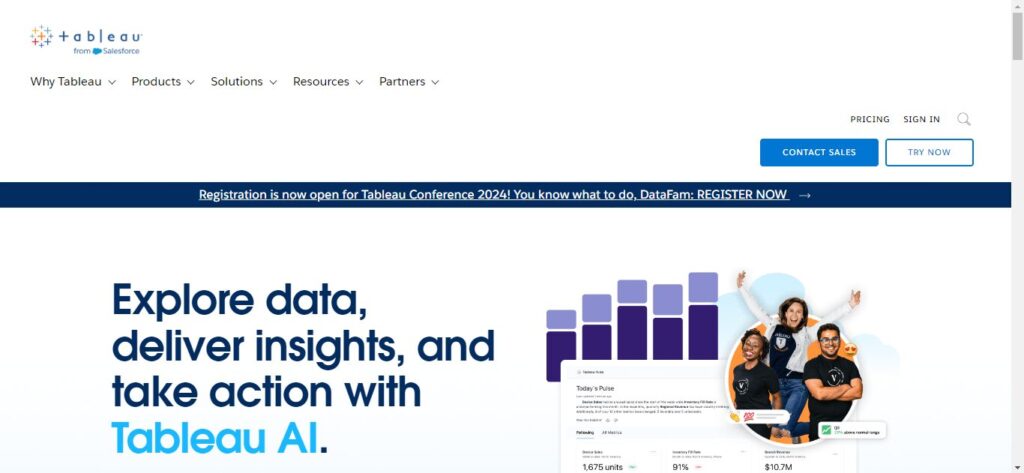
Tableau is an analytics platform that captures data from various sources and thereby creates an informed dataset. It extensively uses data to create a narrative story of the data analysis and present it in the most effective manner. It is an insightful tool that helps users create breathtaking visuals with the help of its advanced data visualization tools.
Features:
- Tableau provides an excellent feature wherein users are allowed to collaborate in teams.
- It is a user-friendly platform.
- You can connect with multiple data sources that help you split the required data into multiple sections to optimize large datasets.
- The array of visualization options, from dynamic charts to interactive maps, allows users to communicate insights in a way that captivates and resonates with their audience.
- It is unique due to its intuitive design, simplicity in setup and use, accessibility to support, capacity to connect to a large number of data sources, and flexible integrations.
Pricing:
- Tableau is one of the most expensive BI tools among all others available on the market currently. Tableau’s cost per user per month, billed annually, is $70.
3. Microsoft Excel and Power BI
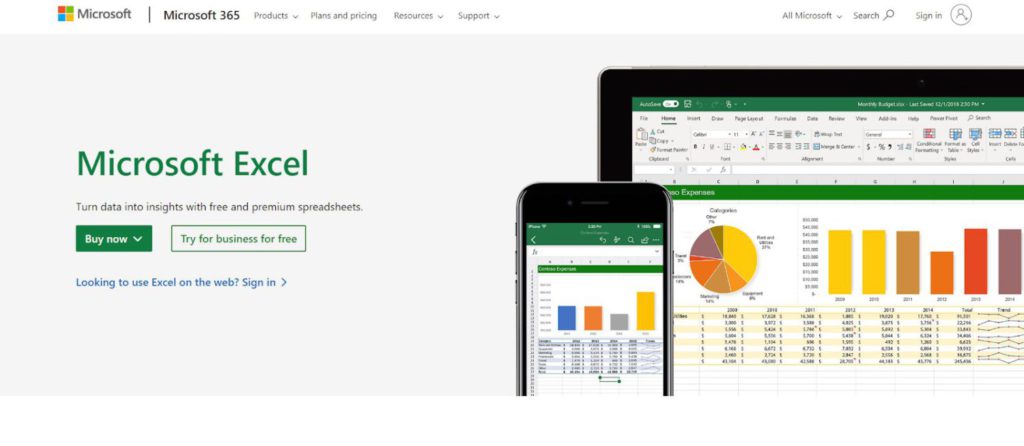
Excel is a software program that uses spreadsheets for financial analysis and is accessed by businesses all around the world. The platform provides excellent data visualization tools that transform data into a captivating plot using graphs, charts, etc.
For an even better data visualization experience, you can switch to Power BI. It is a specialized data analytics and data visualization tool with easy basics and robust features.
Features:
- Excel aids in tracking finances, creating to-do lists, planning schedules, and even building self-correcting puzzles.
- Power BI is a flexible tool with no transformations needed.
- PowerBI has an impressive selection and bookmark feature that can be used to create noteworthy visuals and dashboards.
- It enhances reporting capabilities.
- It is an affordable tool that integrates with the tools used by Microsoft.
Pricing:
- Excel is free, and most businesses already have access to it due to its wide enterprise-level adoption. The Power BI service offers both free and paid license options. Paid options are Power BI Pro and Power BI Premium.
Also, you may read Best data analysis tools – A Must Read!!
4. Zoho analytics
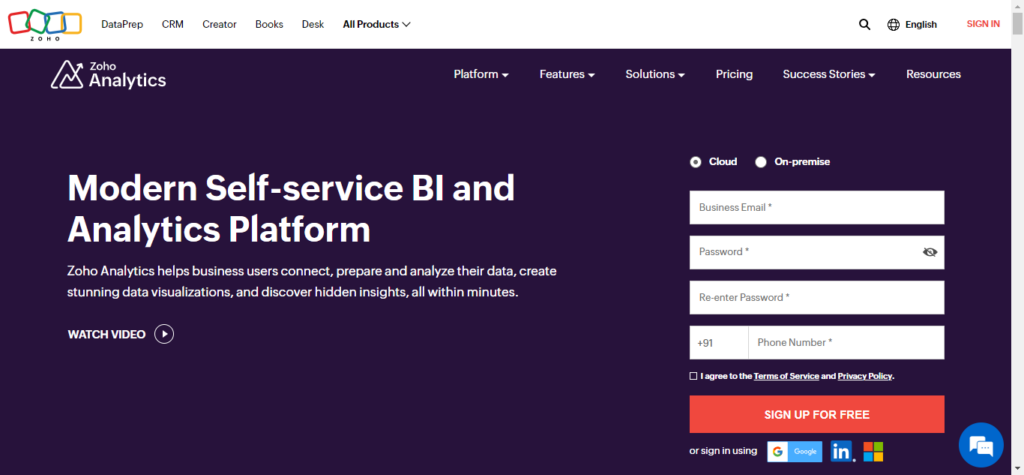
Zoho Analytics is a BI and analytics platform using which you can simply analyze your business data and generate informative reports and dashboards for well-informed decision making. It doesn’t require IT assistance to develop and distribute effective reports.
Features:
- The platform offers exceptional features in several areas like dashboard, writing SQL query, making pivot table, graphs, etc. making it a variable tool for project management.
- The user interface of Zoho Analytics is very clean and intuitive.
- It allows organisations to create, delete, edit, upload, and analyze their business datasets.
- The application provides opportunities for creating custom metrics.
- It helps to understand customer interests and requirements and provides the best technique to market products. It provides customized reports that help users to understand which product is sold and how much customers are satisfied with the products.
- The software is good for small and medium scale businesses with low data volumes across business verticals and functions.
Pricing:
- The platform offers various pricing plans which are, Basic plan – Rs.960/month billed annually, Standard – ₹1,900/month billed annually, Premium – ₹4,200/month billed annually (most popular), Enterprise – ₹15,850/month billed annually, and custom.
5. Qlik sense
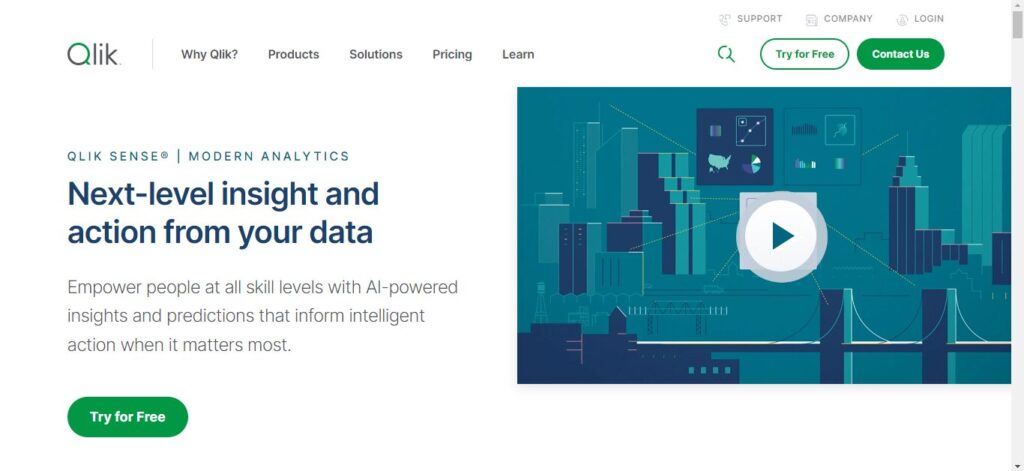
Qlik Sense is a business Intelligence (BI) platform that stands out for its unique approach to data visualization and analysis. Unlike some traditional tools, Qlik Sense uses the concept of data association, allowing users to intuitively analyze data.
Features:
- The UX is very intuitive and needs minimum end user training for a user to get started on the tool.
- The platform has a good catalogue of connectors to various data sources allowing the tool to import data from a variety of domains.
- It is a highly efficient and consistent tool.
- The ETL capacities and ability to interact with all possible data sources gives Qlik sense an edge over other such tools.
- Intuitive data associoation is one of the most distinctive features of Qlik Sense due to its ability to automatically associate data.
- The architecture is very simple to use and understand even for fresh new users, everything is wrapped up in a single interface. You can model your data, create visualizations and generate insights quickly.
- Qlik stands out as a top analytical tool due to its unique associative engine that enables intuitive data exploration beyond linear queries, fostering unparalleled insights. Its comprehensive data integration capbilities allow for seamless consolidation from varied sources, enhancing decision making.
Pricing:
- The platform is priced at $20.00 per user/month.
Also, you may read 6 Best Financial Modeling Software – Important Read!!
Conclusion
The best data visualization tool to choose will ultimately rely on your needs and tastes. For instance, Tableau’s business intelligence features are comprehensive, and Power BI’s integration with Microsoft ecosystems is smooth but the perfect tool for you depends on variables like the complexity of the data, the user’s skill level, and the needs for integration. Therefore it is advisable to select the best option based on your requirements for each unique project.
Frequently Asked Questions
Which data visualization tool is the best?
the choice of the best tool often depends on the specific requirements and preferences of the user. Some of the popular and widely used data visualization tools include Tableau, Google Charts, and Microsoft Excel.
Are data visualization tools available for free?
There are a few data visualization tools that are completely free to use. A few examples to state are Microsoft Excel and Google Charts.
What is the importance of data visualization?
Effective communication, decision support, and the simplification of complex information are all made possible by data visualization. By highlighting patterns and trends, pointing out abnormalities, and encouraging data exploration, it improves comprehension. Through user engagement, enhanced memorization, and collaboration, visualizations promote a more educated and significant use of data in a variety of sectors.


