Thinking about the year 2009, how a genius/ geniuses under the name “Satoshi Nakamoto” created a world-changing new digital currency. Following that, the New Liberty Standard published a Bitcoin exchange rate that establishes the value of a Bitcoin at US$1 = 1,309.03 BTC, using an equation that includes the cost of electricity to run a computer that generated Bitcoins. Coming back to 2021, it is hard to believe how time has passed and how crazy things are today. Bitcoin reached an all-time high price of $69,044 on November 09. If someone were to tell you in 2011 that BTC will be priced at $69k in 2021, would you have bought it? I guess NO! Though, you should have.
There are a variety of factors that led to the mass adoption of Bitcoin. Eventually, Ethereum and other Blockchain networks entered the market with their native coins/ tokens to fulfill demands not offered by Bitcoin.
Cryptocurrency falls under a technology called “Blockchain”. Blockchain is a digital and completely transparent ledger. All the data in the blockchain ledger is accessible by anyone who can run the network’s node. Blockchain ledgers consist of records distributed over a vast network of nodes where a single node, person, or organization is not authorized to make changes or control the flow of information unilaterally. And with Blockchain, all the data is publicly available. Therefore, one can analyze, research, and conclude various factors using this data.
Also Read: A Candid Explanation of Bitcoin
On-Chain data
With the advancement and adoption of cryptocurrency trading, people started looking for metrics to predict the future of these cryptos. This is where on-chain data and on-chain analysis steps in. On-chain data refers to all the data stored on the block of a blockchain network.
There are three types of on-chain data:
- Transaction data: This type of data includes sender’s and receiver’s addresses, the amount transferred, the remaining balance in a specific address, etc.
- Block data: Block rewards, miner incentives, and timestamps related data are categorized as block data.
- Smart contract code: Blockchain networks like Ethereum provides a platform to build Dapps on top of it. In addition to that, smart contracts are an essential part of such DApps. Each smart contract has logic and also a unique contract address.
Availability of on-chain data is an important factor one should consider while trading crypto. Because the blockchain is legit, it should not have anything to hide in terms of supply distribution, transaction addresses, miner/staking activity, etc.
Also Read: Bitcoin and Gold – Is it the right comparison?
What is On-chain analysis?
As the crypto investment community is quickly maturing, we’re seeing an incredible number of intelligent folks jumping into the on-chain analysis. The market will continue to grow exponentially though there will be bumps and crashes along the way; the study might help us a little here and there.
Various metrics have been identified to analyze on-chain data to conclude outputs and results. However, one should remember that cryptocurrency is more similar to money or commodity than company stock. So one cannot apply traditional metrics bluntly to cryptocurrencies.
The on-chain analysis is not based on sentiment, hype, or technical analysis. Instead, the on-chain analysis follows a driven approach. User adoption, miner activity, staking curriculum, historical events, and many more factors of a crypto asset are considered in the on-chain analysis.
History
Coin Days Destroyed (CDD)
On-chain analysis can follow its set of experiences similarly to 2011 when coin days destroyed was created as a valuation metric for bitcoin. This metric is calculated by taking the number of individual coins (technically UTXOs) and multiplying it by the number of days they were last spent. This metric gave the maturity of the coin in particular.
What is its significance?
It provides us with data about how old coin is coming into circulation again. Today, this metric is not entirely dependable because now the data is clouded by the significant outliers. Let’s take a look at the CDD graph.
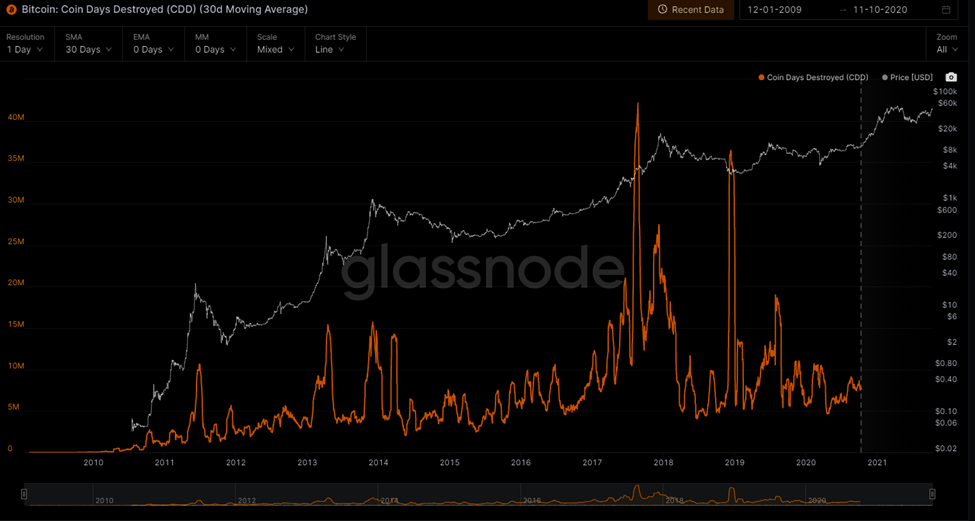
Here, we can see that particularly in the upward trend, CDD is higher, which means investors who purchased BTC at a relatively lower price are booking profits. It also gives us the idea that there’s less activity going on on-chain during a bear market.
Also Read: Ethereum versus Bitcoin
NVT Ratio
In summer 2017, Coinmetrics, Chris Burniske, and Jack Tatar popularised another on-chain metric: Network Value to Transaction (NVT) ratio. This metric is used to determine the utility value of a cryptocurrency. In addition, it is used to estimate how much the market is willing to pay for the transactional utility of the Blockchain.
Here, we compare the value of the Blockchain network with the volume of transactions recorded on the network to identify when a cryptocurrency is overvalued/ undervalued.
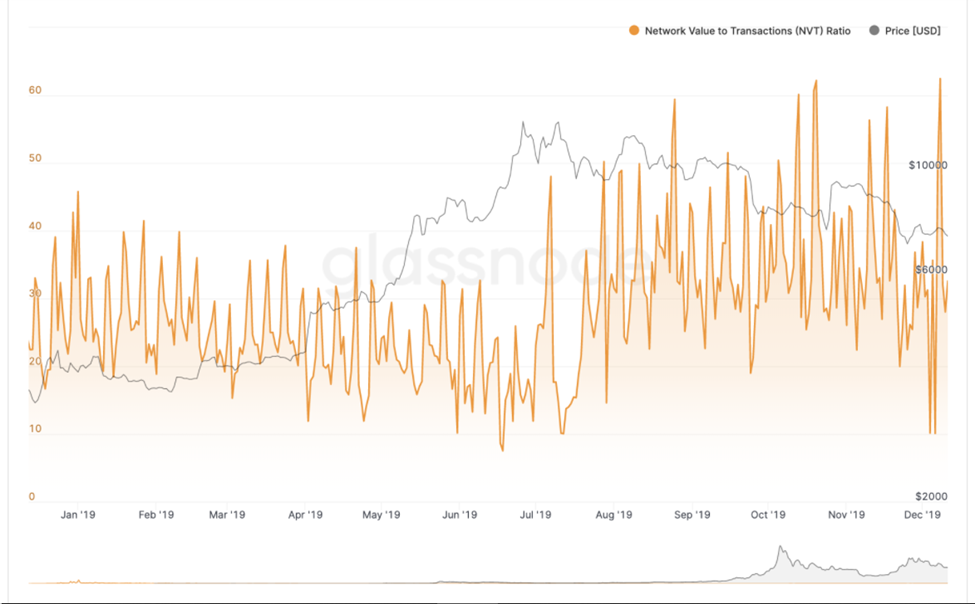
When the volume of transactions does not justify the value of the network, i.e. the NVT ratio is relatively high, it suggests a potential growth opportunity of the crypto. Conversely, a low NVT value indicates a bearish sentiment.
How to measure the NVT ratio?

Obtaining On-Chain Data
There are two ways of obtaining blockchain data for on-chain analysis:
1. Running a node: One can run the node of a blockchain network. Running a node means that you are storing and maintaining a complete copy of the ledger, as well as you can check incoming transactions and that the consensus rule is followed.
Running a node is easy. It’s just software you install and run. It needs good internet and a lot of disk space but not a high spec system. But running SQL on top of the data to generate required outputs needs a fast SSD and more CPU speed. A precise analysis requires figuring out what data is required and how this data will be processed. Being well versed with SQL or any other language in this domain is a requirement. Also, general and open-ended analysis is more beneficial when you run a fully queryable dataset.
2. Analytics website: As the crypto industry has matured, many data and analytics platforms have jumped up to serve cryptocurrency traders and investors.
A few examples of where you can obtain blockchain data are listed below:
Coinmetrics
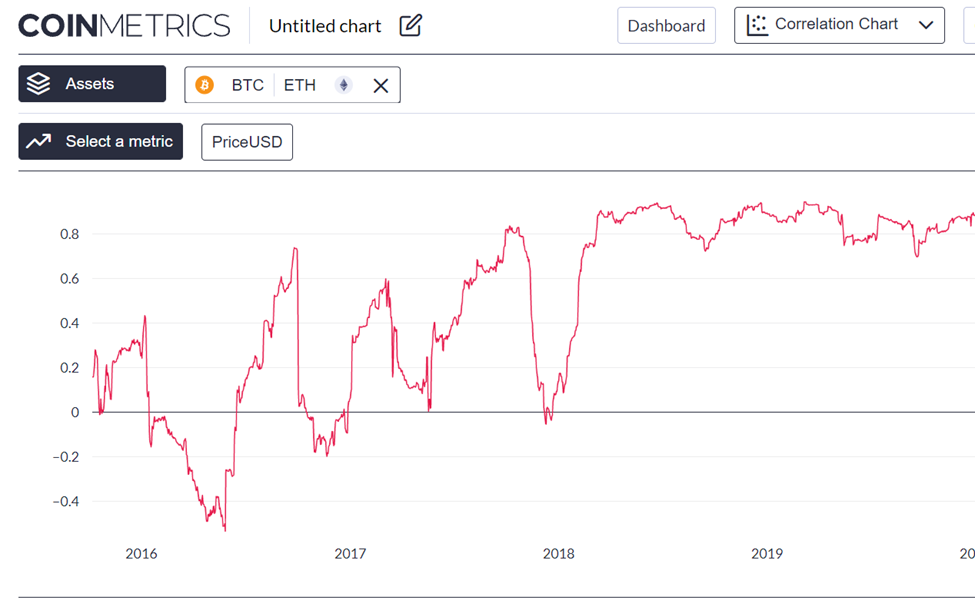
CoinMetrics provides freely available data on crypto-assets, including on-chain metrics and correlations. CoinMetrics products and services include providing network data, market data, indexes, and risk management. You can also follow their blog for a better understanding.
Glassnode
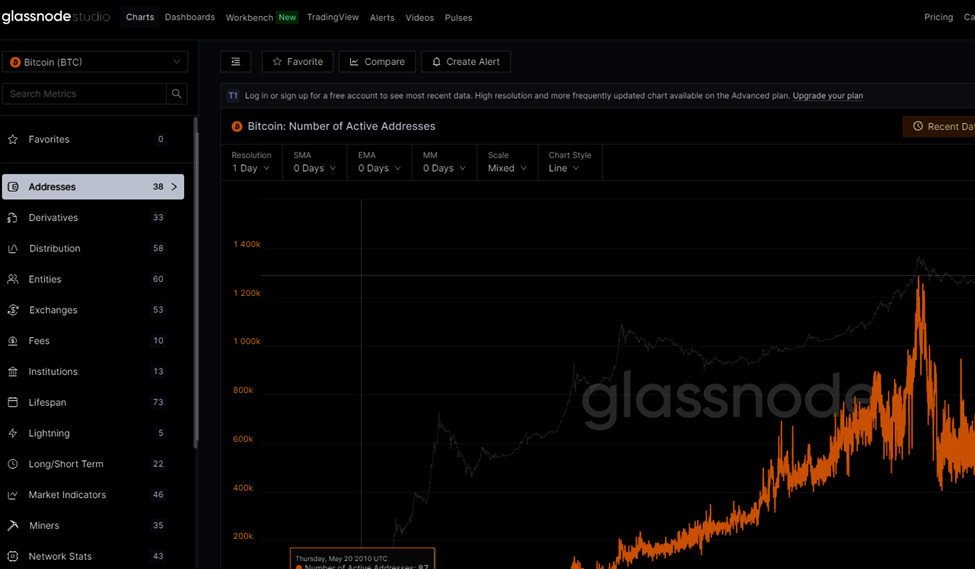
Glassnode is a blockchain data and intelligence provider that generates innovative on-chain metrics and tools for digital asset stakeholders. Glasssnode provides basic metrics for free, but few advanced indicators and high-frequency time-series data come under a paid plan. Glassnode also has a series of tutorial videos on youtube to learn how to use the metrics.
IntoTheBlock
IntoTheBlock uses data science and cutting-edge research in AI to deliver actionable intelligence for the on-chain analysis for a variety of crypto-assets. It also offers order book data and sentiment analysis.

Crypto Quant
CryptoQuant offers comprehensive data for crypto trading. It includes market data, on-chain data, short/long-term indicators for Bitcoin, Ethereum, Stablecoins, and ERC20 tokens.
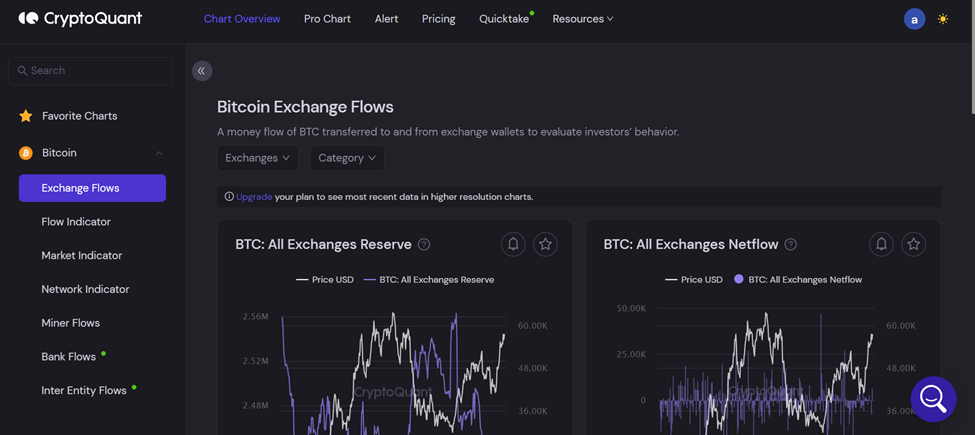
There are more such companies like Santiment/ Sanbase, CQ. Live, etc.
What are the Limitations of On-chain Analysis?
Notwithstanding the promise of on-chain analysis, it is as yet in its developmental stages, and given the restricted back history of data, the utilization of the metrics might advance over the long haul, or recent trends might be featured that lead to the formation of new metrics as the blockchain industry develops.
Contrasting on-chain analytics across numerous crypto-assets requires observation and analysis. Since not all blockchains are equivalent, some metrics might work for crypto and may be irrelevant for a few others. However, this is a positive sign that people are paying attention to these critical datasets.
On the other hand, the availability of fewer data of the new crypto-assets might be a drawback for their proper analysis. And with blockchain space evolving every day, relevant and precise metrics today might not be as accurate in the future. Therefore, one should be updated about what’s going on in the space for up-to-date analysis and output.
Also, read


