Implementing a trading strategy is the most important part of a trader’s journey. Therefore, this article will help you learn one of the most famous trading strategies, and at the same time will allow you to test your trading strategy.
If you’re new to the crypto space and you wanna make some money by trading crypto, 3 things might hover in your mind:
- You want to gain returns without loosing money.
- You need no simulators to do that
- Further, you might need to tweak and improvise on trades
Table of contents
What should be your approach?
Assuming that you have at least 10 different trading strategies and you want to know which one yields the best result.
Or assuming that you are a follower of some influencer. Furthermore, they shilled a strategy which they claim to be 90% accurate in winning trades (it’s, however, better to do your own research).
I will take one decent well-known trading strategy and test it. Therefore, the best way to learn is with an example, and hence below is one such.
In case you’re not familiar with the terms used in this article then head over to our article on Blockchain technology and crypto vocabulary.
Also, read Best Crypto Trading Bots.
Is it the best trading strategy?
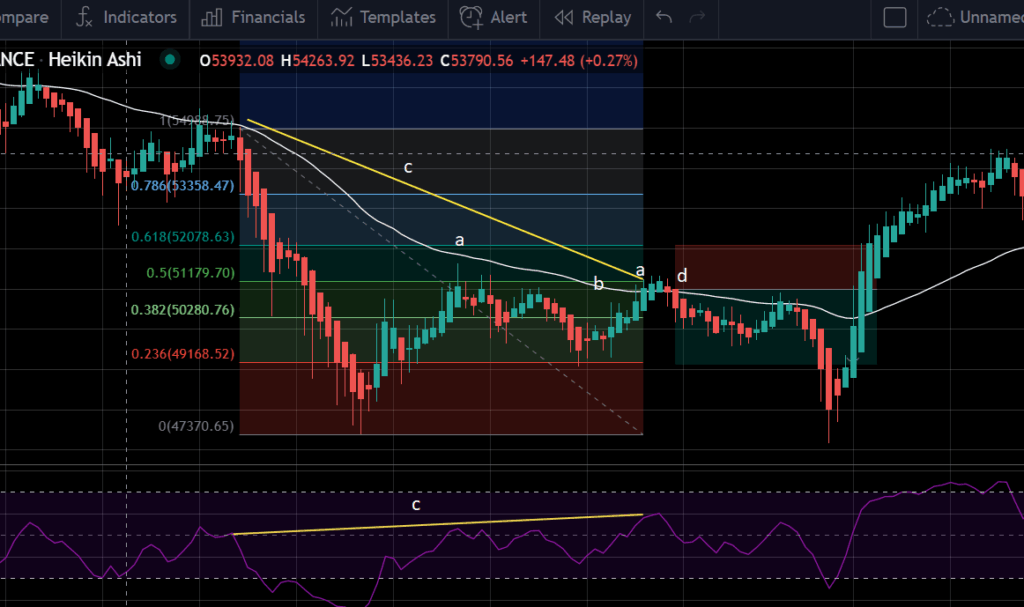
A strategy with 3 different indicators: Fibonacci; 50 EMA; RSI
Settings: 50 Period exponential moving average & 14 Period RSI settings

Test your Trading Strategy: Long Position Rules
- Pull back down to the 50 EMA.
- Draw the Fibonacci to make sure the price has pulled back to at least 50 % retracement level which is 0.5 band.
- Furthermore, spot the hidden divergence (Higher low on the price, Lower low on the RSI)
- Once all these are spotted, wait for the bullish bar for a buy signal.

- Set the stop loss below the wick
- You can set 1 to 1 risk ratio or 1 to 2; However, I set it to ratio 1:1.

- In this case, I lost the long position by a small margin.
Also, read My Experience with Crypto Copy Trading.
Test your Trading Strategy: Short Position Rules
- Price to pull up to the 50 EMA, unlike looking for pullback down to the 50 EMA in setting up a long position.
- Further, draw the Fibonacci, the Fibonacci retracement to the 50 level.
- Spot the hidden divergence (for short lower high on the price, Higher high on the RSI).
- Now wait for the bearish candle for a signal.

- Set 1 to 1 Risk ratio or 1 to 2; I set it to ratio 1 to 1.5

How to test your trading strategy?
Now, all you need to do is segregate the chart by Bullishness and Bearishness. For example, since May 2021, it is all bearishness; before April 2021, there was a period of an intense run.
With the help of Long and Short position rules that your strategy holds, search for patterns and apply them to historical data.
This will help you backtest your strategy and understand how useful it is during Bearish and Bullish times.
How many tests to be run?
You should run at least 25 tests for each of the Bulls and Bears. When the outcomes of such tests are averaged out, you will analyze the strategy with a high degree of proximal accuracy.
Final thoughts
The strategy shared is an example, and you need to test your own strategy the way you place long and short positions.
Furthermore, average it out by Wins and Losses and also segregate which position won the most.
- Bearish Times = Long wins & Short Wins
- Bullish Times = Long wins & Short Wins
Take commission/ fee into consideration and evaluate the success rate. If you win a trade, you get less than what you won, and if you lose a trade, you lose more than you lost.
If your strategy works 70% of the time or more, I believe that can yield you decent returns.
Also, read Best Binance Trading bots.
Test your Trading Strategy: Conclusion
It is worth noting that investors always outrun traders.
Furthermore, using leverage Rekts 95% of the people.
All the best!
Written By – Eth!c@l Aka Kumar


