In the following report, we have analyzed the Komodo project’s codebase using different development metrics. The purpose of this report is to explain Komodo’s progress from a pure development perspective. We have analyzed Komodo’s codebase to understand its development efforts.
Summary
We found that the overall development health of the Komodo project is good. Here are the key findings:
For example — Etherum project has more than 100 repositories. We major all of them while calculating our ranks. CoinCodeCap rank (C3 Rank) get calculated based on CoinCodeCap Points (C3 Points).
- Komodo team continue to add code/documentation at a decent pace. On average Komodo team pushed 570 commits/month this year across 18 repositories (Not including forked and other repositories).
- The team also working on documentation around its different software projects.
- The Komodo team took on average 1.55 days to merge a pull request, which shows an excellent development engagement.
- Komodo’s main client could use more contributors.
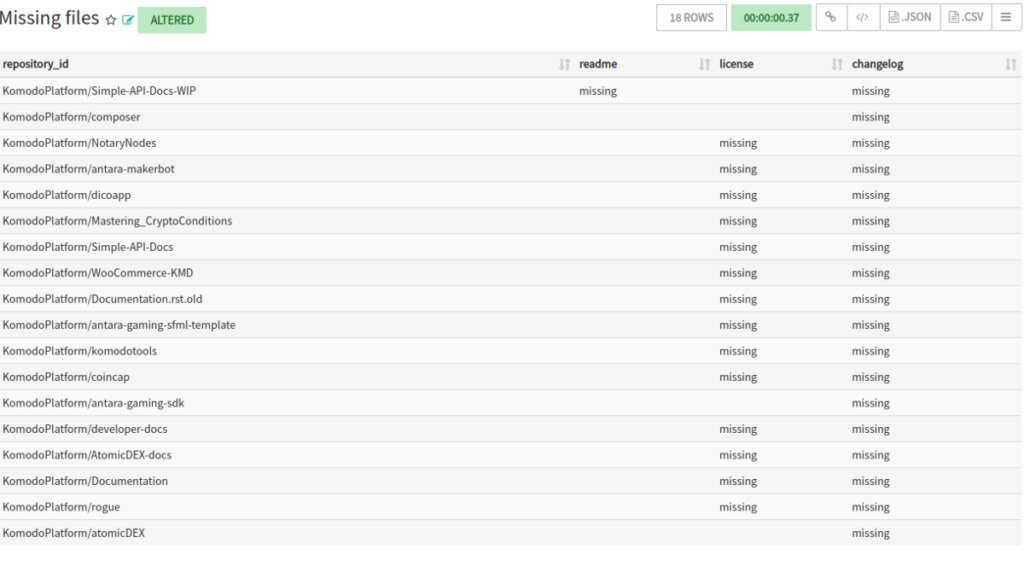
- Almost all the repositories we analyzed missing licenses and changelogs.
We also created a PPT to visualize our key findings, Download PPT.
Introduction to Komodo project
Komodo is a “build your blockchain platform” with powerful features and its own cryptocurrency KMD. In 2016, Komodo’s lead developer, James ‘jl777’ Lee, was working on a project called SuperNET on Nxt.
The Nxt team implemented significant changes to the codebase without consulting any of the other projects built on the Nxt platform. Those changes broke SuperNET’s backend tech.
This event showed the limitations of the single-blockchain platform model. jl777 issued a Declaration of Independence in response and announced the Komodo project.
Terminology
We will use the following keywords throughout our analysis.
Github Repository: A folder hosted on Github containing a software’s codebase/documentation.
Commit: A commit is saving some file changes into the Github repository.
Pull request: Notifying others about the changes you have pushed on the codebase.
Contributors/Collaborators: Person who work jointly on a project.
Fork: A fork is a copy of a repository. Forking a repository allows you to experiment with changes without affecting the original project freely.
Limitations
There are a few limitations to our approch.
- Our analysis only focused on development based on Github data, not on the technology.
- Komodo has 66 repositories, we only analyzed 18 repositories. We omitted the all forked repos (including Komodo’s main client)
Note
- Some of these repositories also have documentation, which is crucial for project success. Documentation is a standard part of the development process.
- Komodo’s Main client is a fork of the Zcash project, which in turn a fork of Bitcoin project. We have analyzed Komodo’s main client separately in the end.
- The time range for Overall project analysis starts from April 2018 to October 2019. This will help in understanding current development trends.
Overall Project overview
Komodo team works on different technologies and their documentation across 66 repositories. But for our analysis, we will not include the forked repository and will only analyze 18 original repositories. Let’s deep dive into different development metrics of the Komodo project.

We measured the overall project health and focused on a few key points :
- Code contribution
- Contributors health
- Development engagement
1. Code Contribution
Code contribution helps us to understand the project’s progress. For this, we will look into commits statistics and how they grew over time.
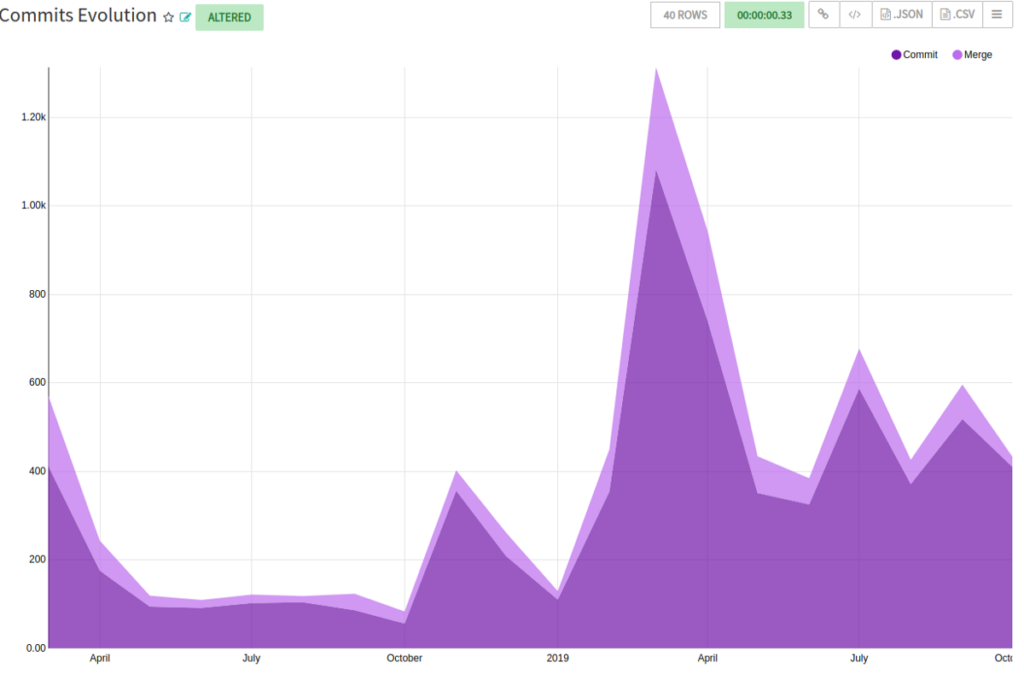
Commit Evolution
Commits are basic metrics to understand project progress. As you can see, Komodo pushed much more code/documentation in 2019.
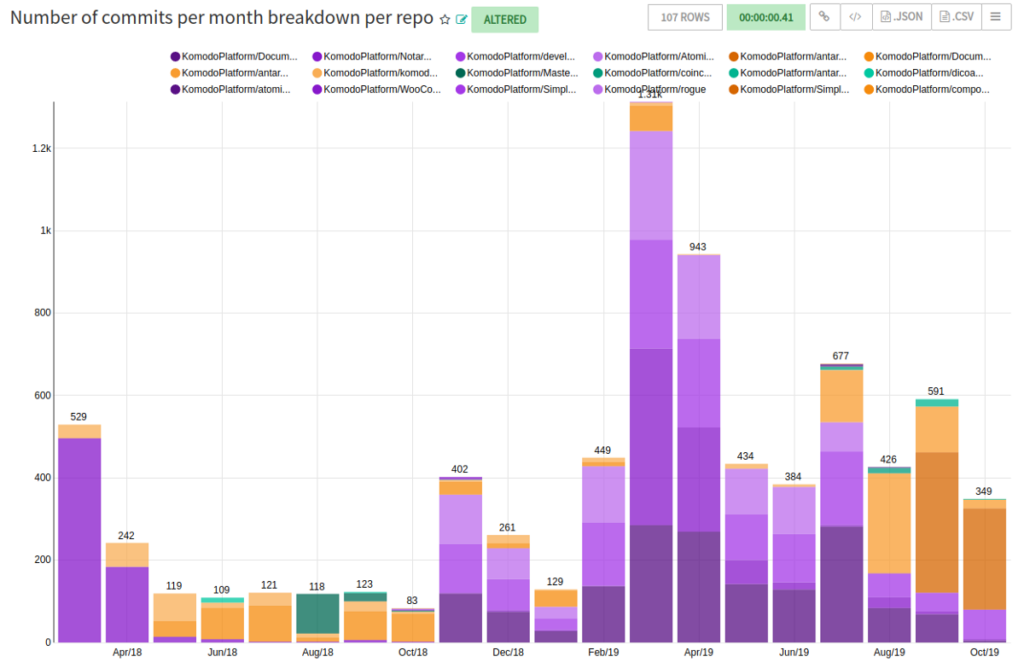
Number of commit per month breakdown per repo
In 2019, the Komodo team has pushed 570 commits every month on average across all repositories. You can see that there is a lot of work going on documentations in the last few months.
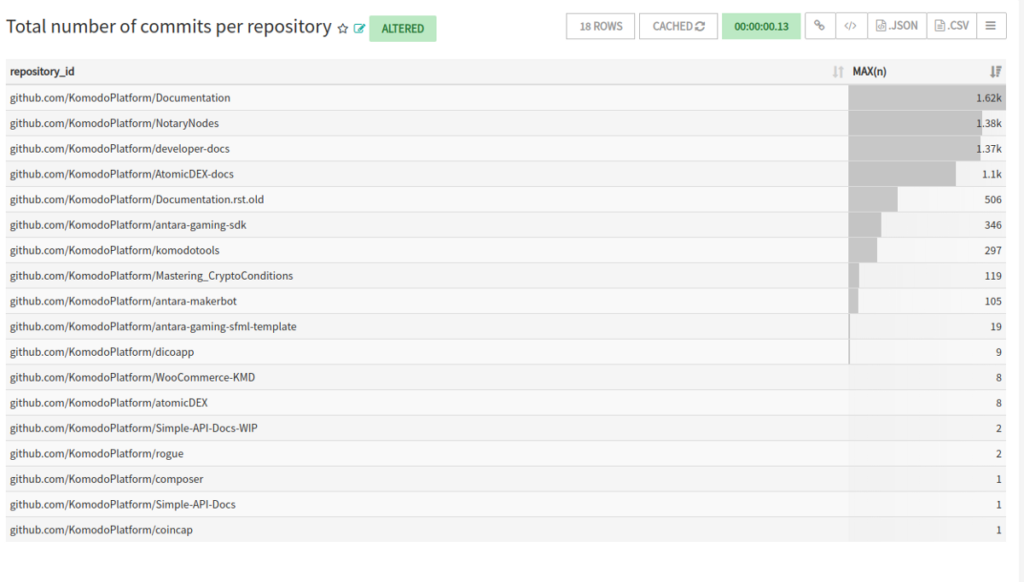
Most active repos
Let’s also understand where Komodo is putting its efforts recently. As you can see, there is a lot of work going on documentation and newly released “Build your own blockchain” framework Antara.
Commit activity day wise
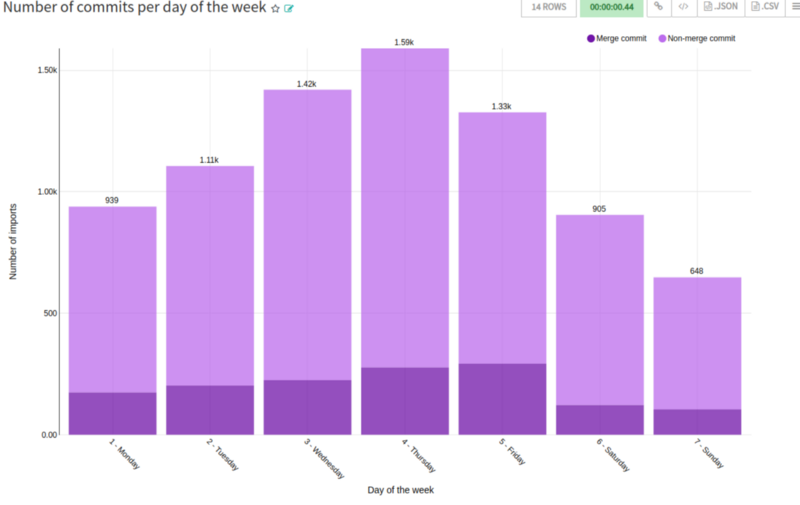
With a distributed team, people contribute to the project almost all the time. As the following chart suggests, this is also true for the Komodo project. Contributors to the Komodo project are pretty active and contribute every day of the week.
2. Contributors health
A good team is always important for the project’s success. The most popular open-source projects, such as Linux or React, have thousands of contributors.
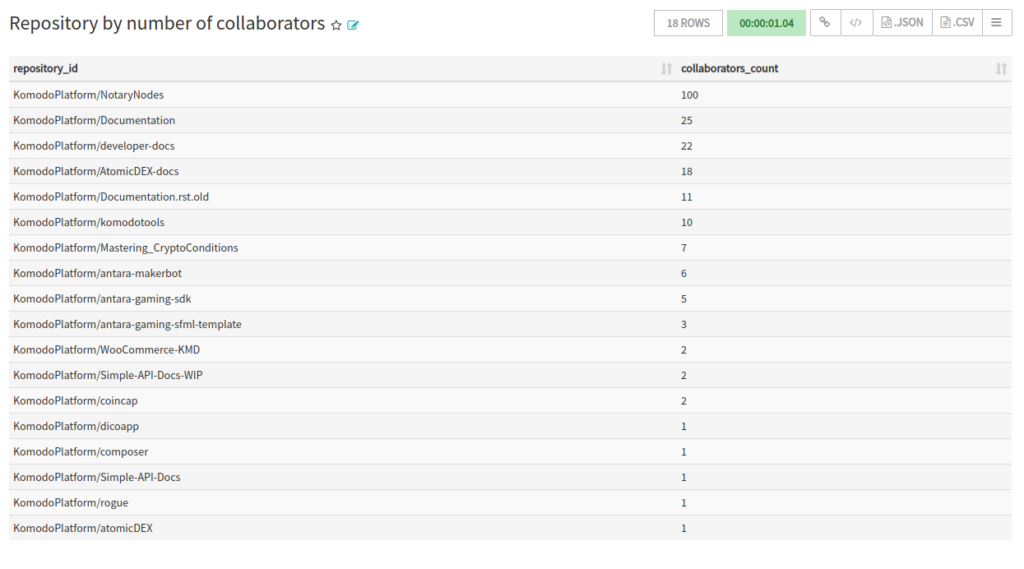
Contributors also showcase the community strength of the project. Komodo consensus algorithm is dPoW (Delayed Proof of Work), where notary nodes participate in the consensus. Komodo’s NotaryNodes repository keeps track of this process and updates information around it. A large number of contributors in this repository shows that Komodo has a good notary nodes community.
A good amount of contributors to documentation repositories shows that Komodo is serious about its documentation.
Komodo recently released the Antara framework, and you can see there are sufficient contributors for Anatara related repositories. Komodo project has a healthy amount of contributors, which shows its vibrant community.
3. Development Engagement
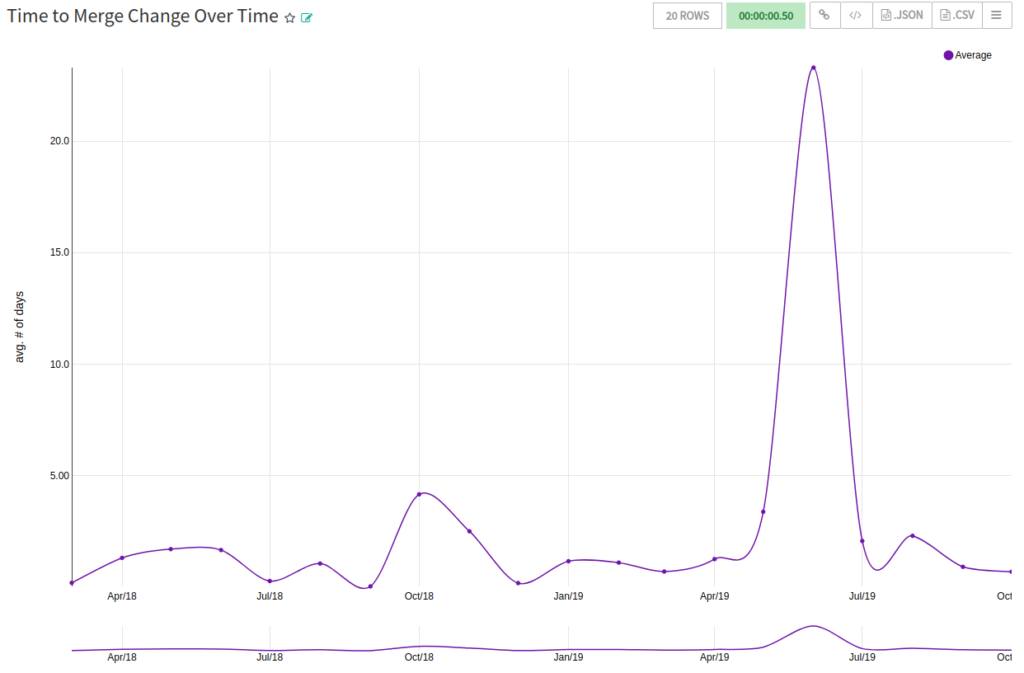
To understand development engagement, we will look into pull requests. In open-source development, whenever you want to contribute to any repository, you can create a pull request. Then maintainers of the project (Or the owner of the repository) review the pull request and either merge it or reject it. This is a standard development process.
Merging Pull request usually requires engagement as you need to understand the changes someone trying to add in the codebase.
Komodo’s average time to merge a pull request is 1.55 days (Which is around 36 hours), which is pretty impressive.


Number of Files and Languages
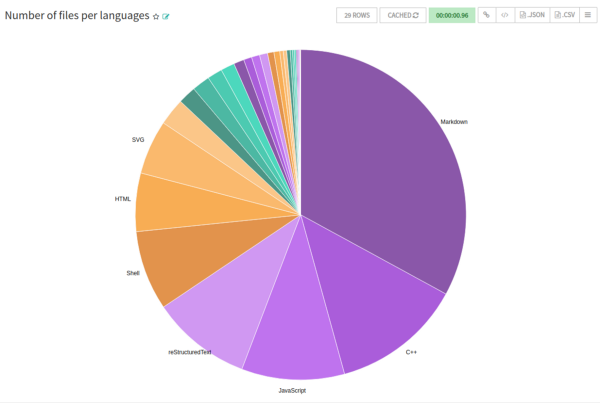
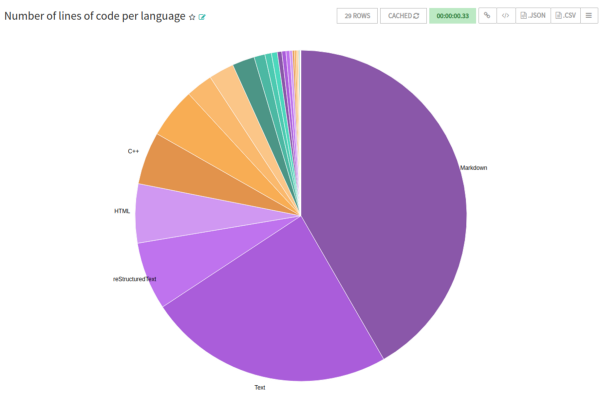
There are a total of 29 languages throughout Komodo’s codebase (Not including forked repos). The largest set of these files in Markdown (MD) language which used for documentation.
Readme, License, and Changelog
A standard open source project must have three essential things.
- Readme file — This helps other developers to explain the repository content and how to use the codebase.
- License — License for the software.
- Changelog — A changelog is a record of changes to the software. It can be pretty crucial for people who are using the software.
Komodo championed the docs, but licenses and changelogs are missing from most of its repositories.
Email Cloud
Email cloud helps us to understand different organizations involved in the project just by looking at emails of contributors to the project.
Here you can see that multiple different organizations involved in the Komodo project.

Development Analysis for Komodo Main client
Komodo’s principal repository is its client. An important thing to remember that Komodo’s main client is a fork of Zcash, which in turn forked from Bitcoin.
As Komodo forked in late 2016, changes on the client is primarily done by the Komodo team since then. So we mainly focus on the last two years’ metrics.
What is a blockchain client?
A blockchain client is an implementation of the specification of technology (White paper). Multiple machines running this client software creates a blockchain network
So let’s deep dive into Komodo’s main client repository analysis:

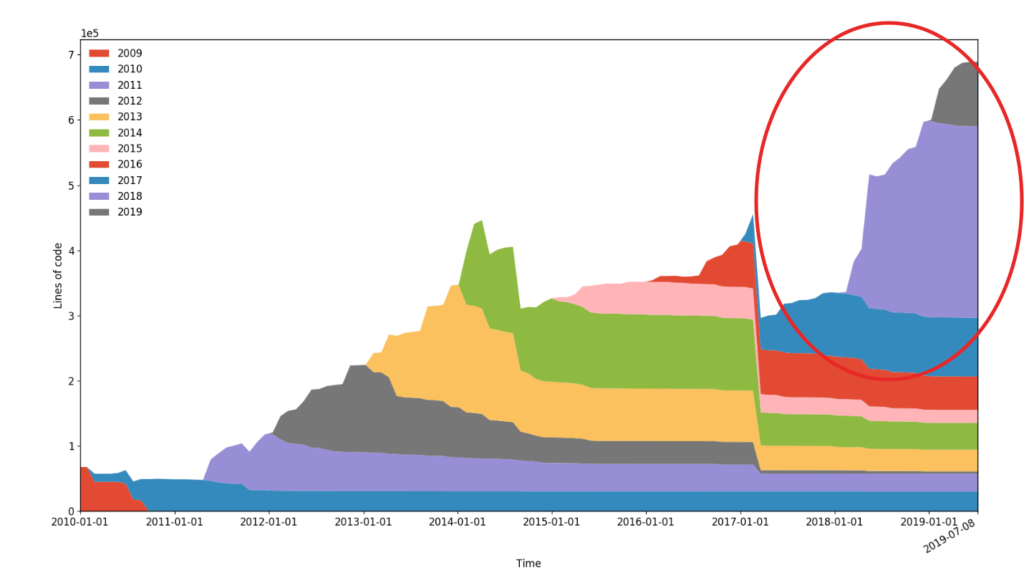
Burndown Analysis
Burndown analysis shows the lines of code surviving throughout the time in the codebase. As the chart shows, almost 60% of new code added just in 2017–19.
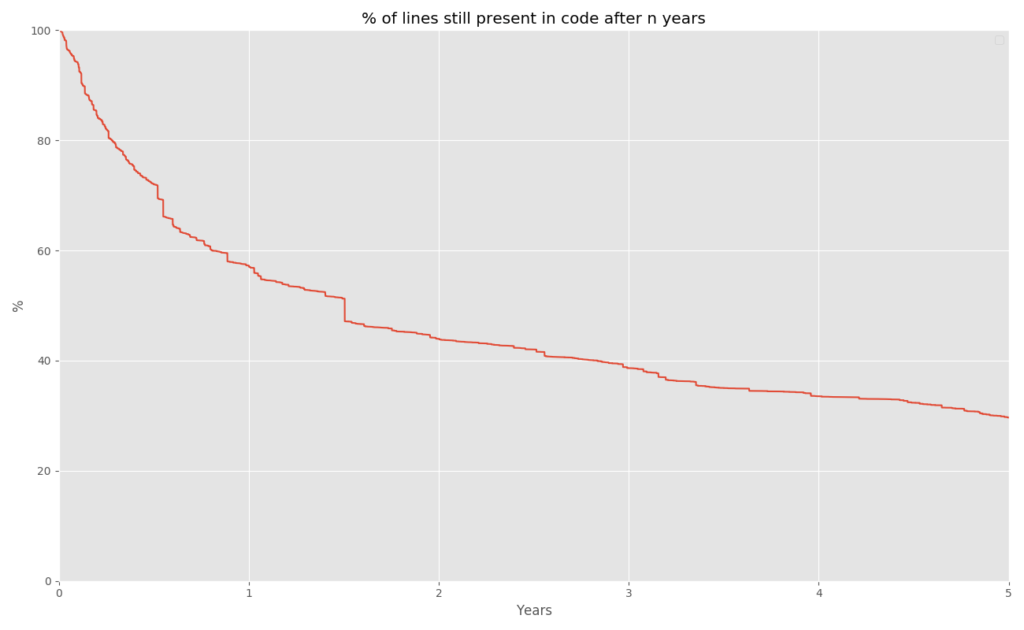
Code decay
We can also visualize how individual commits are decaying over time. This analysis can be done by aligning all commits on X-axis and measuring the aggregate decay of the overall code. Only ~30% code is surviving for the last five years.
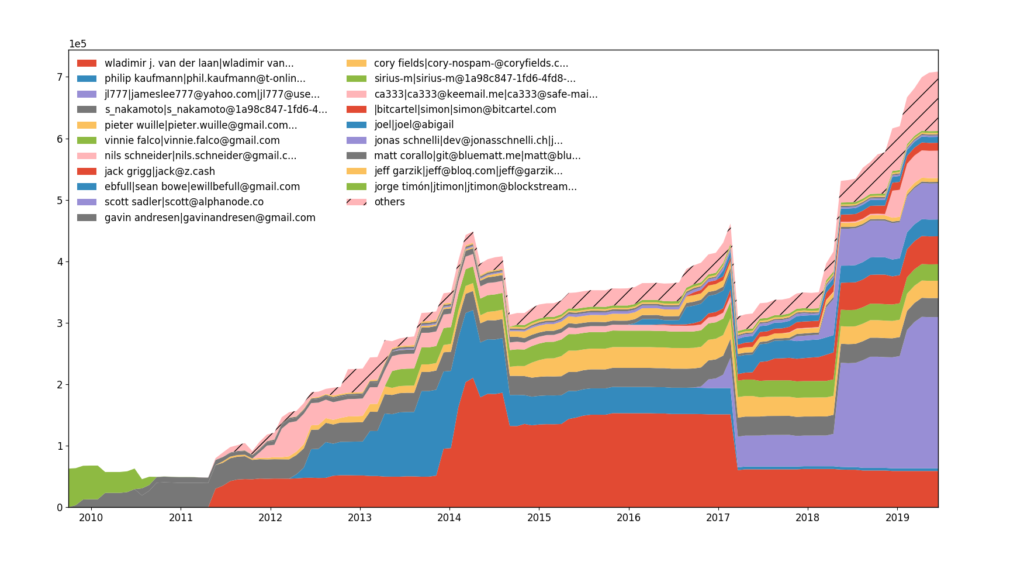
Komodo developers analysis
The following chart shows the code ownership. That is, how many lines of code is alive over time for each identified developer. As analysis done on the whole codebase, you can see the top two developers are Bitcoin developers. Then you can see jl777 (Komodo’s development lead) owning most of the Komodo’s client codebase
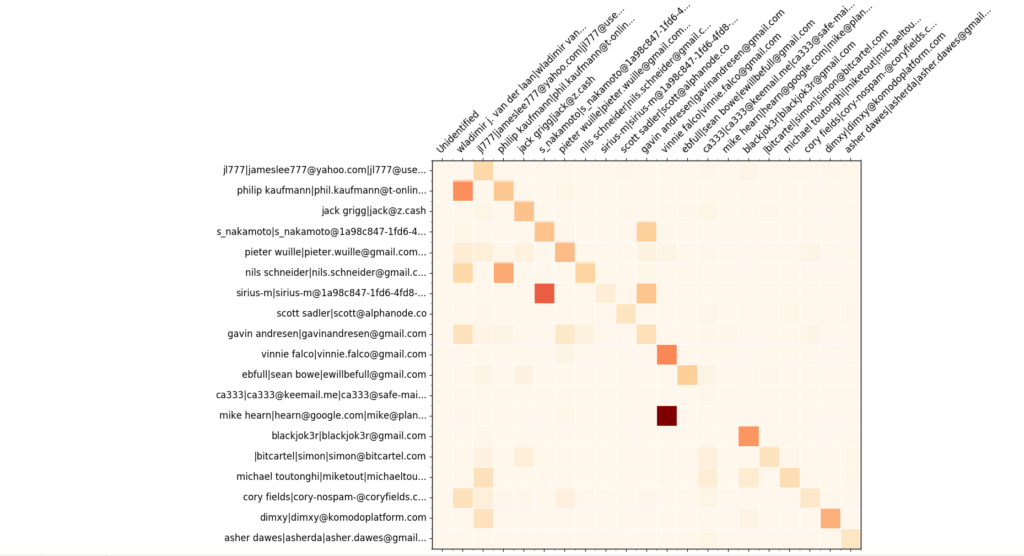
Overwrites matrix
Below is the overwrite matrix based on the “added and deleted lines” statistics per developer. Using this, we can visualize how lines of code of developer ‘A’ removed by developer ‘B.’ It indicates collaboration between people.
The format is the matrix with N rows and (N+2) columns, where N is the number of developers.
- The first column is how many lines were written by the jl777 and deleted by unidentified developers and hence on.
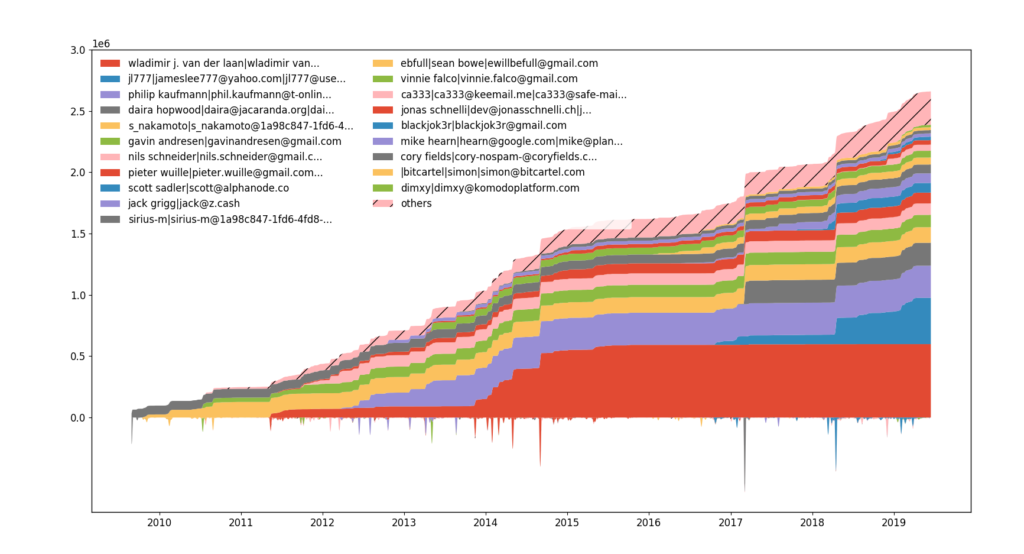
Developer Effort
Let’s also estimate the developer’s effort that is “how many lines have been changed (added or removed) by each developer.”
The upper part of the plot is an accumulation of the lower. The upper part is showing overall changed lines, and the lower part is showing developer contribution(effort) for that period.
It is impossible to have the same scale for both parts, so the lower values are scaled, and hence there are no lower Y-axis ticks. There is a difference between the efforts plot and the ownership plot, although changing lines correlate with owning lines.
You can see jl777 has written a lot of code from the Komodo team since 2017, pushing his efforts on 2nd posting in the below chart.
Added vs Changed Line
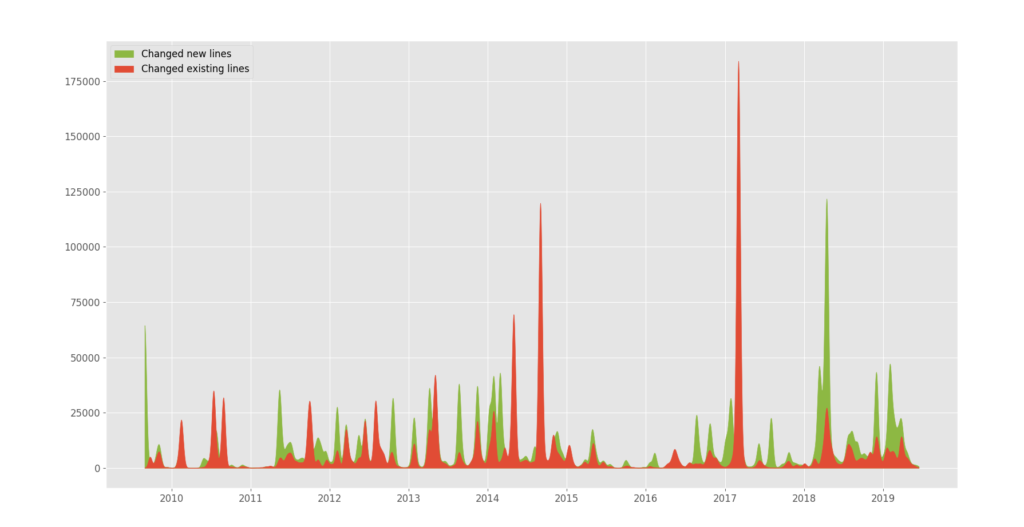
The below chart shows how many lines of code were added and how many existing lines changed (deleted or replaced) through time in the codebase.
Komodo was forked from Zcash in late 2016. You can see there was a lot of code edited in 2017 and then a new code getting added since then.
Brooks’ Law
Brooks’ Law states that adding more people to a late software project makes it later. The reason for this is communication and coordination overhead.
While we add more people to a project, the total number of available hours increases linearly, but the coordination paths increase exponentially. Hence, there’s a point beyond which each additional person’s hours get consumed by the increased coordination efforts.
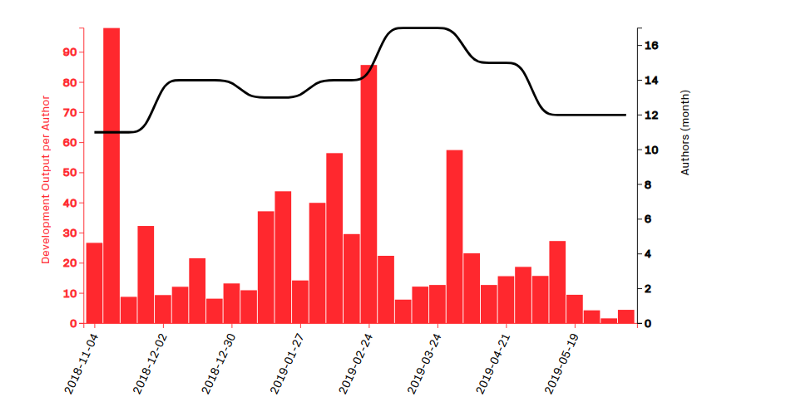
The below graph shows the Development Output: This is measured by taking all commits during a week and dividing them by the number of contributing authors. The resulting normalized output metric gives you an estimate of the organizations’ output.
The below graph shows the Development Output: This is measured by taking all commits during a week and dividing them by the number of contributing authors. The resulting normalized output metric gives you an estimate of the organizations’ output.
Below chart shows two things:
- The number of contributors to the Komodo main client is declining.
- Yet development output remained consistent in the last one year.
Conclusion
Using the above metrics, we determined that the overall health of the Komodo project is good, and the project is putting sufficient effort into its development. Other than that, Komodo is also putting a lot of effort into its documentation, which is very crucial for project adoption.
Things like License and changelogs can be improved, and Komodo’s main client could use more contributors. There are a sufficient amount of contributors to the project which contribute to the project significantly, and development engagement is pretty good.
Visualizations
We have created a visualization of changes made by Komodo contributors in the past two years (Arp-17 to Aug-19).
Here different colors show their contribution in the respective languages (See there is a language classification at top left)
- Each particle is a file. It moves from developer to developer.
- The size of the particle depends on the degree of changes.
- Each user gathers files that he used over time
Komodo’s development since 2017
It shows file changes in every commit by different Komodo contributors since Jan 2017.
About CoinCodeCap
CoinCodeCap analyzes the codebase of various cryptocurrencies. Anyone can showcase development activity on their platform using our APIs.
We also help in development audit reports for Cryptocurrencies. If you are a crypto project or a crypto exchange, you can reach us at [email protected].

