With numerous new platforms/ software everywhere, it is hard to comprehend the functionality of a platform. One of the many platforms is – MultiCharts.
In this article, we will review MultiCharts.
Table of contents
- What is MultiCharts?
- Summary (TL;DR)
- MultiCharts Tools
- MultiCharts Review: How to use MultiCharts?
- 1. How to download MultiCharts?
- What are the PC Requirements for Multicharts?
- 2. How to Open a Demo Account?
- 3. How to log into MultiCharts?
- 4. How to attach to a data feed?
- 5. How to use workspace, charts and desktops in Multicharts?
- 6. How to use Multicharts Trading?
- 7. How to use Multicharts market replay?
- MultiCharts Review: Pricing
- MultiCharts Review: Customer Support
- MultiCharts Review: Pros & Cons
- MultiCharts Review: Other Features and Highlights
- MultiCharts Review: Conclusion
- Frequently Asked Questions
What is MultiCharts?
MultiCharts is an extensive charting and technical analysis platform. It provides traders high-definition charts and an expansive range of technical indicators.
MultiCharts extends advanced tools like portfolio backtesting, market replay, and a PowerLanguage programming interface. It’s integrable with many external brokerage trading services and supports live and simulated trading.
It works on a User-Friendly programming language {patented programming language called PowerLanguage} that is great for amateur programmers and has a good range of third-party add ons.
Summary (TL;DR)
- MultiCharts is a charting and technical analysis trading platform supporting live and simulated trading. It provides HD charts and numerous analysis indicators and features like backtesting, market replay, EasyProgramme Language, and a range of add ons.
- It is a user-friendly program with an easy-to-follow and functional platform. It is highly customizable and works at our command.
- This subscription software charges a fee that is more than many platforms out there. However, unlike other platforms, it does not charge commissions on trades.
- MultiCharts has a sound 24-hour customer support base. Experienced agents and technical expertise make up customer support with options like remote desktop connection, discussion forum, video tutorials.
- There is a 30-day free trial period and a subsequent subscription fee ranging from $66 to $1497.
MultiCharts Tools
MultiCharts provides various tools on the platform to make it suitable for rookies and experts. Here are all the principal tools available:
1. Complete and Informative Charting
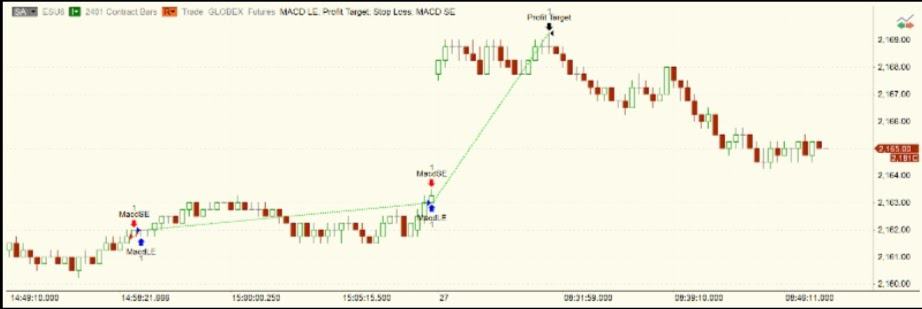
The best element of the MultiCharts trading platform is its charting abilities, tools, and features. The charting features of MultiCharts are highly functional. The charts are exceptionally high definition. Traders can work with multiple data series and symbols, creating up to 20 sub-charts in one chart with a compact interface.
Charts are easy to customize, with a mere right-click on the chart. Traders can fully personalize their charts to suit their trading styles and preferences. Add drawings, and comments, change colors, mix resolutions, compress and expand scales. Use data feeds to analyze historical and real-time data. The options are unlimited.
MultiCharts offers hundreds of built-in indicators {but the indicator list isn’t searchable}. Editing indicators is also simple, with settings for how often indicators and chart studies recalculate.
2. PowerLanguage
MultiCharts’ PowerLanguage programming interface is directly taken from EasyLanguage programming and is valuable for non-coder users. With the PowerLanguage editor, we can follow multiple scripts on side-by-side windows.
3. Market Scanner
The Multicharts market scanner is an attractive tool for active traders since scans update at set intervals (down to one minute) automatically. Scans are simple to set up. We have an indicator and signal library of MultiCharts or our custom functions and indicators built using PowerLanguage to develop filters.
The results display of the MultiCharts scanning window is spectacular. We find tabulated information about all of the indicators based upon our filters. Better yet, we can expand any individual stock in the results list into an expanded chart with just a single click.

4. Dynamic Portfolio Backtesting
Proper backtesting helps us determine if our strategies will make or lose money.
Dynamic portfolio backtesting is precise and can apply our strategy to many symbols on a bar-by-bar basis, determining which trade is the optimal one at any given time.
Traders can learn and evaluate their methods without risking money. It is a priceless tool to understand technical analysis and strategy development.

How to deploy Backtesting?
Usual backtesting engines have a lot of assumptions and shortcuts, which produce unrealistic testing and unreliable results. MultiCharts minimizes assumptions and considers many factors.
Backtesting starts as soon as you apply a signal to the chart.
Once you apply a strategy to a chart, the backtesting process starts. A View-Strategy performance report generates. You can analyze the backtesting results, adjust the inputs, call the performance report to check the updated results, and continue your trading in automatic or manual mode.
5. Genetic Strategy Optimization
Some traders find optimization profitable because it saves a lot of time searching for optimal inputs for a specific strategy.
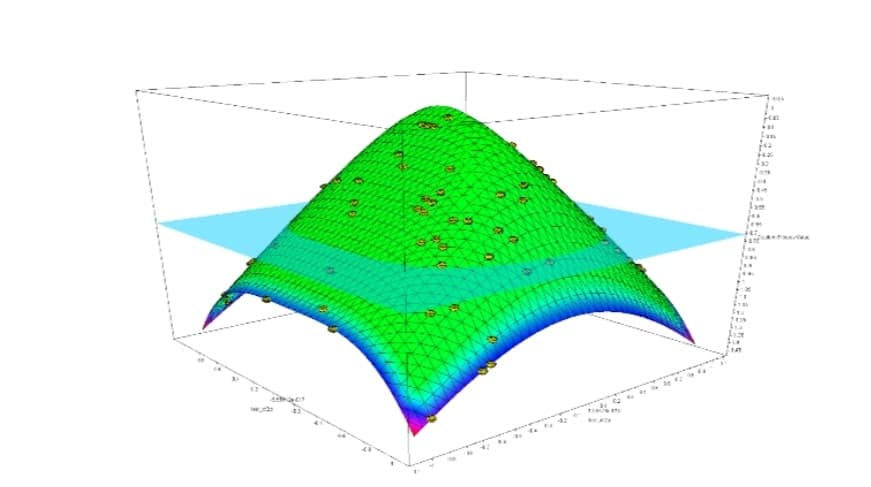
Self-Adaptive and Genetic optimization applies a complex algorithm that tests possible inputs in a way that imitates biological evolution. This approach is quicker than working every possible combination, and it also assists in avoiding outliers and curve-fitting.

6. Replay Market Data
Trading the markets is all about anticipating the movement of price. A foolproof way to exercise is to apply price-predicting skills to historical data.
Market Data Replay enables us to start playback at any point in the past, speed up or slow down replay speed, and even playback several tools at once.
Let’s take a look at how we can use and work these tools to their maximum potential.
MultiCharts Review: How to use MultiCharts?
MultiCharts brings a User-Friendly programming language for inexperienced programmers and has a good range of third-party add ons. It is a trading software for Charting, Backtesting, and Multi-Broker Automated Trading. The software itself is user-friendly. Here is a breakdown of how to use Multicharts:
1. How to download MultiCharts?
MultiCharts is easy to download and operate. The course of action:
- Open the MultiCharts download page.
- Click Free Demo.
- Enter Name and Email Address.
- You will receive all the instructions to download and install MultiCharts via email.
What are the PC Requirements for Multicharts?
The minimum requirement for multiple monitor setup:
- Minimum 8GB Ram
- 2.8 GHz Processor
- Quality graphics card capable of supporting multiple monitors (ATI or Nvidia)
How to Run Multicharts on a Mac?
MultiCharts can not operate on the OS operating system. However, it is functional on Mac hardware using a virtual machine that runs windows alongside the OS. The best option for doing this is using Parallels.
2. How to Open a Demo Account?
There are two options for opening a MultiCharts demo account:
- Directly through MultiCharts
- Through a brokerage account
A brokerage account is a cost-effective and convenient method for using a MultiCharts demo account.
Note: MultiCharta also provides a 30 Day Free Trial.
To open a MultiCharts account:
- Open the MultiCharts download page
- Click the Free Demo button
- You will receive all instructions to download and install MultiCharts via email.
Demo Account Through a Brokerage Account
It is imperative to signup for an account through a brokerage service to access MultiCharts for free. It requires opening a funded account.
A course of action:
- Open a brokerage account via a desirable brokerage service.
- Login to MultiCharts and a section will appear ‘How to login to Multicharts’
- Fill the form that will appear on your screen.
3. How to log into MultiCharts?
Login to the MultiCharts platform with your MultiCharts activation details issued from MultiCharts direct or via your broker. A course of action:
- Select Demo at the Mode drop-down tab.
- Enter your MultiCharts Login details in respective fields.
- Select Finish and MultiCharts will start.
4. How to attach to a data feed?
To trade demo or live, we need to connect to a data feed. There are various ways to get access to market data:
- Thirty days free trial through MultiCharts or a demo account via a brokerage service.
- Open a brokerage account with a monthly data fee.
Data Feed Connection in Multicharts
Upon initial login, MultiCharts asks for Data Feed, Mode (Demo or Live), and login credentials.
To attach data feed via MultiCharts, a course of action:
- Go to File and select Broker Profiles > Manage Broker Profiles.
- Select the data to feed required and select Edit.
- Enter your data feed credentials.
- Under Connectivity. Select Server to connect – Sim / Demo or Live.
- Select OK when done. MultiCharts will connect the data feed.
5. How to use workspace, charts and desktops in Multicharts?
MultiCharts allows users to manage charting screen & chart configurations using charts, workspaces, and desktop settings.
- Charts refer to one instrument chart window.
- Workspaces enable the display of single or multiple charts on single or multiple screens. It provides users configuration settings for individual and multiple charts.
- Desktops allow users to set up and save multiple navigatable Workspaces using a window tab and enable users to save multiple workspace configurations in a single file.
All Charts, Workspaces, and Desktops can be stored, shared, and reloaded for easy retrieval of preferred settings.
How to Open A New Workspace, Chart, And Desktop?
Create a new workspace to open a new chart in MultiCharts. To create a workspace/ chart go to File > New > Workspace/ Chart Window
For Workspace
A new workspace tab appears in the bottom bar. Double click the tab to rename.
For Chart
A Format Instrument Window will appear. Select desired Contract from the list.
Most of the chart settings are under the Instrument, Settings, and Style tabs.
It is a good idea to create a desktop if you prefer multiple workspaces to make retrieval of preferred settings easier.
To create a desktop, go to File > Save Desktop As and select the name and location of your desktop file.
Workspaces and Desktops can be shared and imported to other machines running MultiCharts.
How To detach Charts From A Multicharts Chartbook?
Detaching individual charts from the main workspace is necessary for creating a multi-monitor setup using MultiCharts.
To detach a chart, select the chart. Select Window> Detach Window. The detached chart can be moved to a new monitor or configured separately from the main workspace window as required.
With basic things and usage covered, we will understand how to use MultiCharts for trading.
6. How to use Multicharts Trading?
The Chart Trading feature in MultiCharts enables users to add, amend and cancel orders on the chart.
In the Chart Trading panel are quick buttons for placing trade orders.
How to Enter Order on The Chart?
There are two main ways for placing an order on a chart:
- Click above or below the price. Go to Place Order> Select order type. MultiCharts will arrange the order types available at the selected price.
- In the Place Order left-click to select an order type. Drag and drop a selected order onto the chart.
The order appears on the chart as an order Flag.
To change the price that the order will execute, drag the flag to the correct price point.
Next to the flag reflects the order type and the number of contracts.
Basic order types & entry strategies placed using the on-chart trading feature:
Basic Orders
- Limit order
- Stop Order
- Stop Limit Order
Entry Strategies
- Fade
- Breakout
- Breakout down / Fade Strategy
- Breakout Up / Fade Strategy
7. How to use Multicharts market replay?
The Market replay feature allows simulation trading of any market at any given time. It is excellent for beginner traders who can not always be at market open.
The platform’s market replay function is easy to understand and use. It eliminates the need to download market data manually. A course of action:
- The market replay control panel is in the bottom right-hand corner of the main Window.
- Select how you want to replay data.
- Select the start date and time to commence replaying data.
- Select the Jump to Time button to leap the chart to the desired time.
- Click the Play and Pause keys to control the market replay playback.
- Use the slider to manage the playback speed.
MultiCharts Review: Pricing
MultiCharts is subscription-based software, with subscriptions starting for 3 months to a lifetime.
- A three-month subscription costs $297 {$99/month}
- A six-month subscription costs $497 {$82/month}
- A one-year subscription costs $797 {$66/month}
- A lifetime subscription costs $1497.
These subscription costs are higher than other platforms, but MultiCharts does not charge commissions on trades set through the software.
MultiCharts extends a free 30-day trial to test out the platform as well.

MultiCharts Review: Customer Support
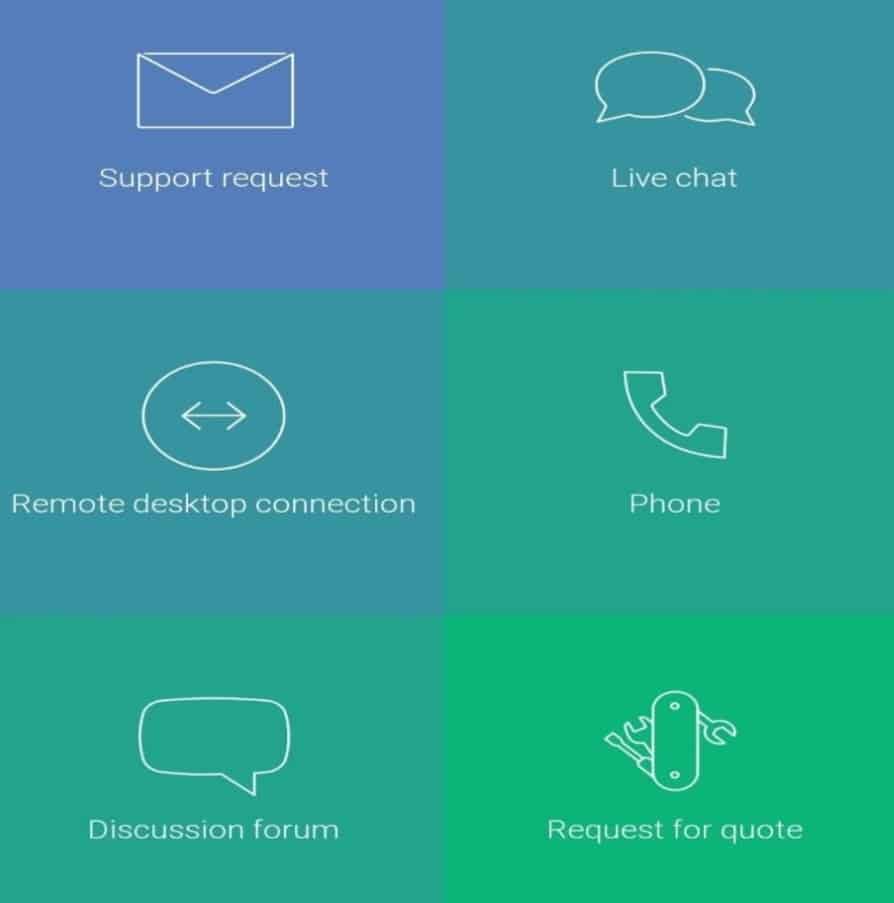
MultiCharts has a strong customer support base. It provides 24-hour customer support. Qualified staff with technical expertise offer High-quality support and timely responses. Other available options include email, live chat, phone, remote desktop connection, discussion forum, and video tutorial on their website. Additionally, they also provide C# and VB. NET support.

MultiCharts Review: Pros & Cons
Like two sides of a coin, everything has its pros and cons. We have tabulated some of the advantages and disadvantages of using MultiCharts below. You can take a quick look at them in the table below and decide further.
| Pros | Cons |
|---|---|
| MultiCharts let us select our trading method, analyze it and start trading with any desired broker | Data feed needs a subscription to compatible brokerage |
| 30-day Free Trial on a fully-featured demo server | Expensive subscription as compared to other platforms |
| Highly advanced technical analysis platform | Indicators, signals, and functions are not searchable |
| High-resolution charts with included indicators and signals | Lengthy Installation time due to the heavy size of the software |
| PowerLanguage programming interface to produce custom indicators | |
| Refreshed market scanner | |
| Market replay with the capability to replay across multiple chart windows | |
| Fast, multi-threaded backtesting and interactive charts | |
| Carry off trades at a click of the mouse | |
| User-friendly interface | |
| Compact Mode for screen space-saving for multiple charts view | |
| Complimentary 24-hour support |
MultiCharts Review: Other Features and Highlights
- Multi Time Frame Analysis
- 300+ Strategies and Indicators
- Real-Time Account Management
- Order and Position Tracker
- Advanced Orders
- 200+ Trading System Analysis
- Interactive Performance Reporting
- 20+ Supported Data Feeds
MultiCharts Review: Conclusion
MultiCharts is a fantastic trading platform with various tools and numerous features. High-definition charting, high-precision backtesting, built-in indicators and strategies, brute-force, and genetic optimization, automated execution, and support for EasyLanguage scripts are all the tools at our disposal. With a sleek and productive interface, it is a go-to choice for novices & experienced traders. It offers traders one-click trading, high precision backtesting, brute force, and genetic optimization.
The bottom line is that this program helps to make the most out of your trading strategies and with its array of functional features.
Frequently Asked Questions
What is MultiCharts.com?
MultiCharts is an electronic analysis and a trading Platform.
The platform presents the means to receive market data, conduct technical analysis, and send and manage orders to a broker, both manually and automatically.
Is MultiCharts a broker?
No, MultiCharts is not a broker. It is a trading platform. We need different third-party brokerage services to work on MultiCharts.
Does MultiCharts have a mobile app?
No, MultiCharts does not have a mobile app. It is a Windows software. Parallels help in installing the app in OS operators.


