Litecoin (LTC), often referred to as the “silver” to Bitcoin’s “gold,” has solidified its place as one of the longstanding and widely embraced cryptocurrencies. Charlie Lee, the brain behind Litecoin and a former Google engineer, brought it to life in 2011 as a unique take on Bitcoin, introducing some noteworthy technical differences.
Litecoin’s mission revolves around facilitating rapid, secure, and cost-effective transactions through the Scrypt proof-of-work algorithm, featuring a nimble 2.5-minute block time.
Litecoin Price Prediction
Litecoin holds a price tag of $71.22, accompanied by a 24-hour trading volume amounting to $472,183,766.19. In the past 24 hours, we’ve seen a modest 0.60% uptick, but over the course of the last 7 days, there has been a -1.60% dip. With 74 million LTC in circulation, Litecoin’s market capitalization tallies up to $5,268,974,375.

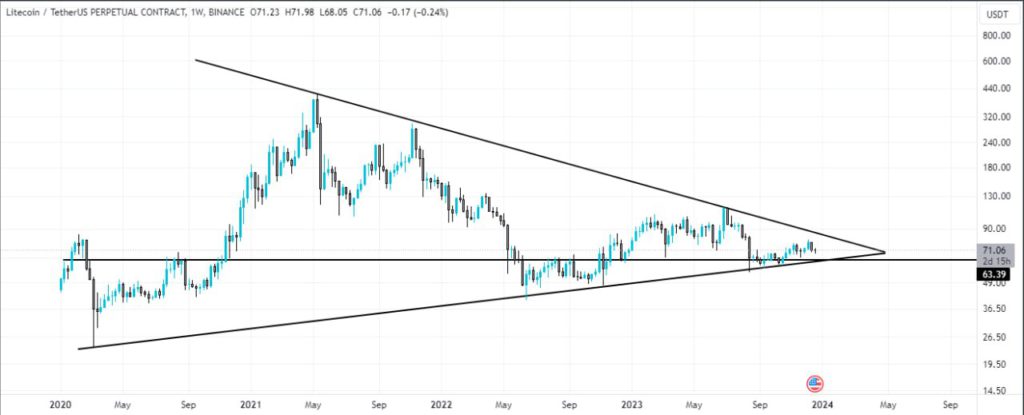
In a weekly time frame, the price is trading inside the symmetrical triangle. Currently, the price is bouncing from the support trendline of the triangle. we have to wait for a successful breakout.
Over the past week, Litecoin has maintained a relatively confined trading range, oscillating between $70 and $75. This signals a subdued volatility and a lack of substantial momentum. The $75 level poses a notable resistance point, aligning with the 50-day moving average. A breakthrough here could spell out a bullish reversal, potentially setting the stage for further gains at $80 and $85. Conversely, a stumble at this hurdle could usher in a continuation of the downtrend, with $65 as a critical support level – the lowest point since July 2023.
Diving into technical indicators, the landscape appears mixed. The RSI hovers around the 50 mark, reflecting a balanced market sentiment. The MACD leans slightly bullish, albeit with a fragile signal line crossover. Meanwhile, the Stochastic oscillator, though bearish, is edging towards oversold conditions. These cues suggest a potential period of sideways movement before a more decisive market shift.
Weekly Price Analysis
A broader view, as seen on the weekly chart, paints a picture of Litecoin’s prolonged descent since its all-time high at $412.96 in May 2021. The cryptocurrency has weathered an 80% devaluation, grappling with selling pressure stemming from market corrections, regulatory uncertainties, competition from alternative altcoins, and a perceived lack of innovation and adoption.
Trading south of the 200-week moving average since August 2021, Litecoin finds itself entrenched in a long-term bearish trajectory. The formation of a descending triangle pattern, typically a harbinger of bearish continuation, adds weight to this perspective. With the lower trendline set at $65, a crucial support juncture, breaching this threshold could catalyze a substantial sell-off, potentially pushing Litecoin to fresh lows, possibly dipping below $50.
On the weekly technical front, indicators echo a bearish chorus. The RSI languishes below 40, signaling a scarcity of buying interest. The MACD retains its negative stance, persistently below the signal line, reflecting a robust bearish momentum. Simultaneously, the Stochastic oscillator resides below 20, underscoring an oversold condition. Collectively, these indicators suggest a heightened risk of further downturns in the near term.
Noteworthy News Highlights
Here are the latest updates shaping Litecoin’s narrative:
- Litecoin Network Surpasses 200 Million Transactions: Celebrating a milestone on December 22nd, the Litecoin network notched up its 200 millionth transaction, underscoring substantial growth and eliciting gratitude from the Litecoin Foundation.
- Litecoin as the Digital Form of Silver: Litecoin is often dubbed the digital silver, complementing Bitcoin’s “digital gold” narrative.
For on-demand analysis of any cryptocurrency, join our Telegram channel.


