The Graph (GRT) is a decentralized protocol for indexing and querying blockchain data using GraphQL.
Once a price breaks above a resistance zone, it signals that buyers have absorbed all the supply from sellers at this level and price can resume it’s advance. Following a resistance breakout, the next closest resistance zone becomes a price target.
For on-demand analysis of any cryptocurrency, join our Telegram channel.
GRT CRYPTO Price Analysis
- Latest Price: $0.227766
- Market Capitalization: $2,174,707,417
- 24-Hour Trading Volume: $321,162,289
- Circulating Supply: 9,548,531,509 GRT
- Total Supply: 10,788,004,319 GRT
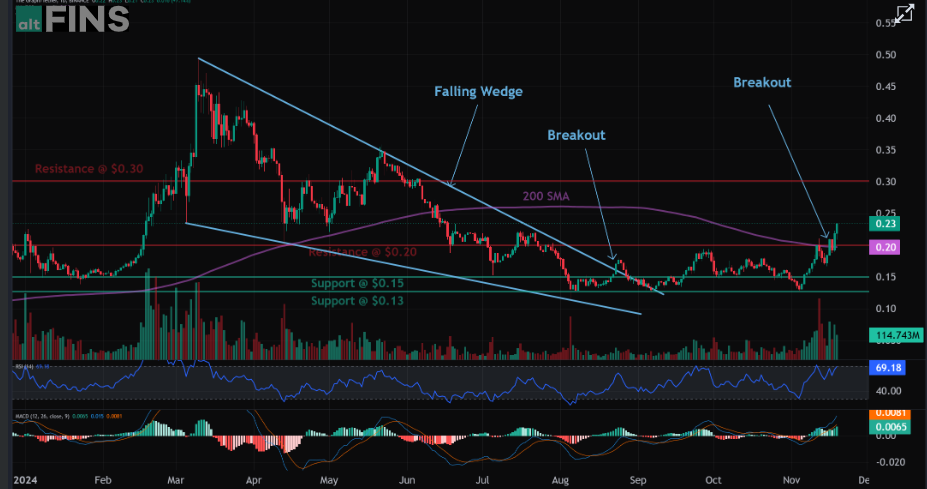
Trends are improving following a bullish breakout from Falling Wedge pattern.
Price broke above a stiff resistance area around $0.20 (also 200-day moving average), which signals resumption of uptrend, with +50% upside potential to $0.30 next. Stop loss at $0.16.
Weekly Price Analysis
Over the last seven days, GRT experienced significant upward momentum, surging by 19.2%. The price has fluctuated between a low of $0.209593 and a high of $0.244991.
- All-Time High: $2.84 (February 12, 2021)
- All-Time Low: $0.052051 (November 22, 2022)
- Trend: Short-term trend is Strong Up, Medium-term trend is Strong Up, Long-term trend is Neutral.
- Momentum is Bullish ( MACD Line crossed above MACD Signal Line) ABOVE days ago. Price is neither overbought nor oversold currently.
- Support and Resistance: Nearest Support Zone is $0.15, then $0.13. Nearest Resistance Zone is $0.30.
Key Indicators
- Relative Strength Index (RSI): 58.38.
- Moving Averages: Short-term moving averages suggest a buy signal, while longer-term indicators show mixed trends.
- Volatility: GRT recorded a one-month volatility of 6.71%.
The Graph Crypto News Roundup
- Bullish Sentiment: Market sentiment around GRT remains positive, with 77% of technical indicators signaling a bullish outlook. The Fear & Greed Index for the broader crypto market is at 69, suggesting optimism.
- Ecosystem Development: The Graph continues to expand its integration within decentralized applications. Its tokenomics supports active participation by indexers, curators, and delegators.
For on-demand analysis of any cryptocurrency, join our Telegram channel.

