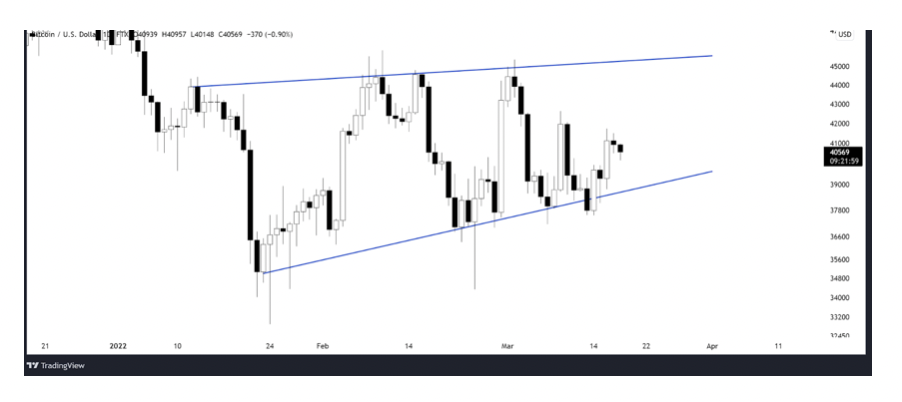
On-Chain Analytics and Derivatives from a pure price structure standpoint, Bitcoin has now been consolidating for roughly 2 months now.
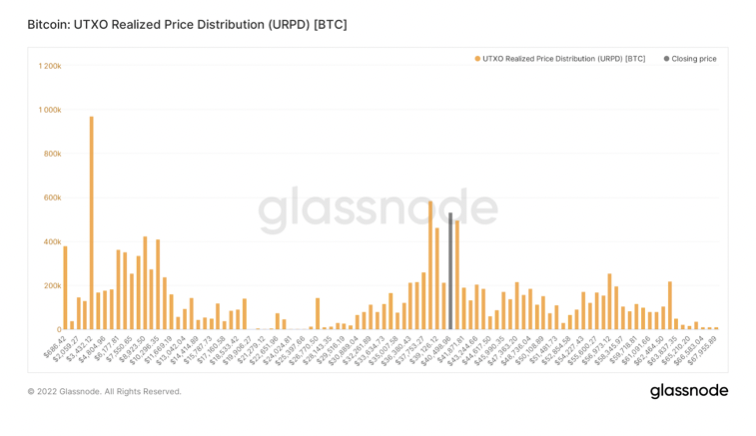
From an on-chain perspective, this is visualized by URPD, which is very similar to traditional volume. The only difference is that this shows you the amount of Bitcoin’s money supply that has last moved at each denominated price level, making it more dynamic. You can see the cluster of volume in this $36k-$45k consolidation, with roughly 20% of Bitcoin’s money supply has moved here.
The spot premium we’ve been talking about for weeks is still persisting, making it longer than the regime that took place last summer.
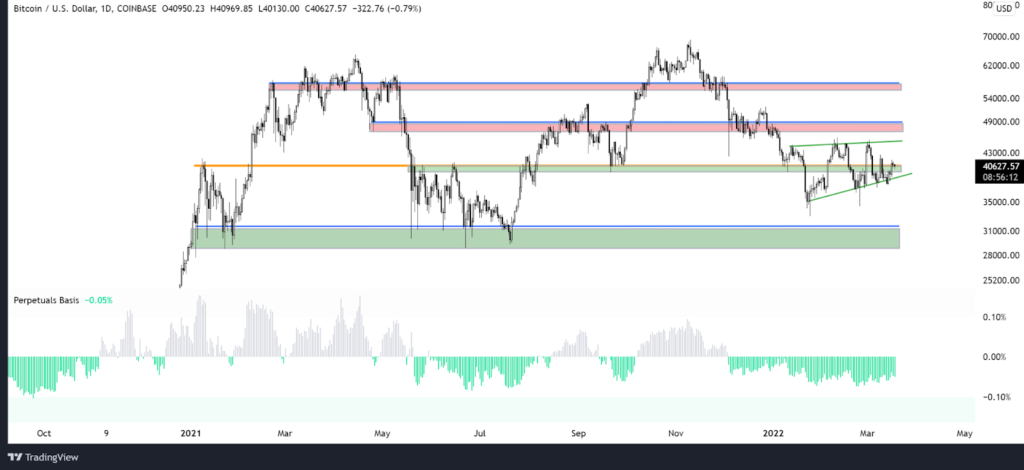
As you can see in the chart, this basis has generally followed price for the last two years, although didn’t reach nearly as high as it did in late 2021 (18%)as early 2021 (45%).
As you can see over the last month or so this has just been trending down, not quite following price. IMO is another signal of lack of exuberance from the derivatives market in addition to open interest and general spot premium to perps.
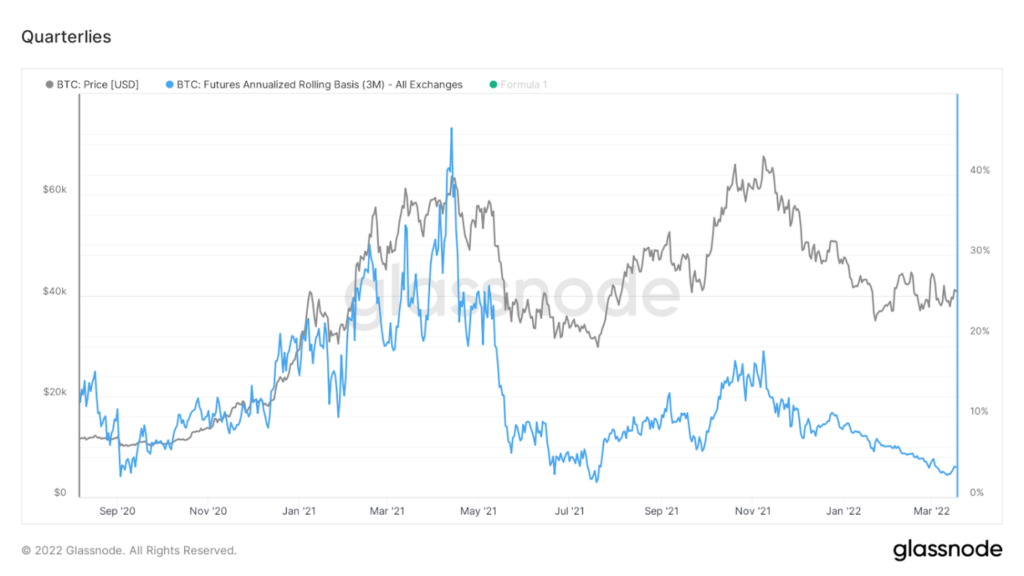
Another way to visualize this is by comparing Bitcoin prices to quarterlies.
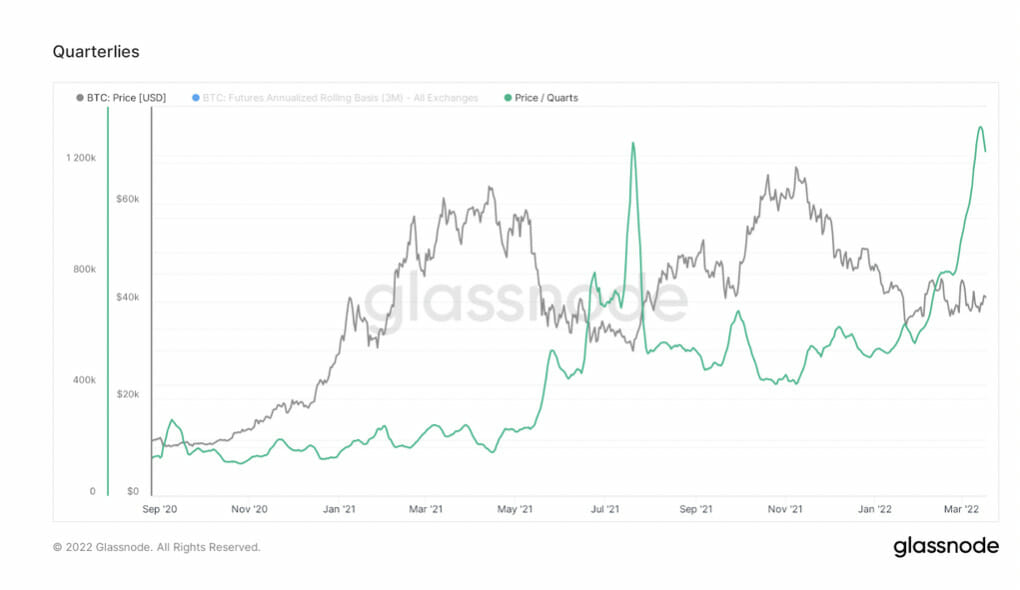
Overall, seeing a lack in exuberance from derivatives.
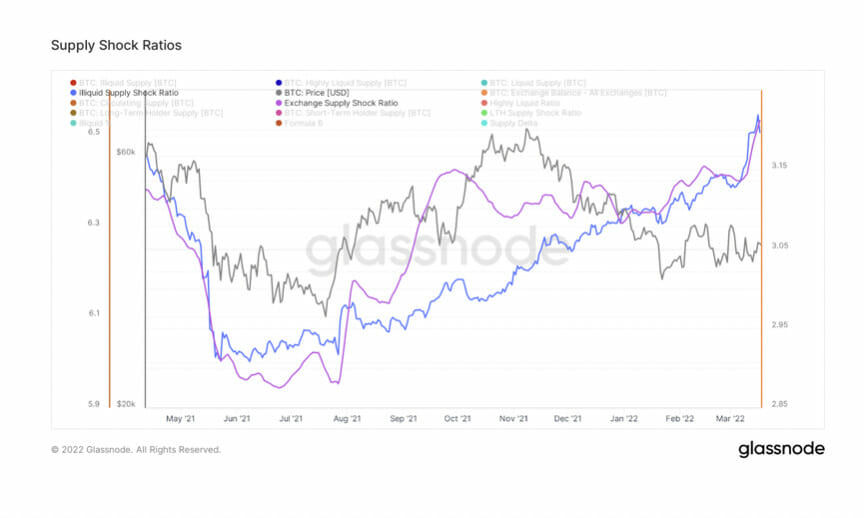
Let’s dive into a few on-chain supply dynamics. In pink we have the exchange supply shock ratio, showing you the number of coins available to be bought on exchanges versus coins, not on exchanges. The uptick this week shows a fair amount of coins withdrawn, particularly from Coinbase upon doing some further digging.
This (blue line) tells you the number of coins that are held by on-chain entities that have a statistical history of selling less than 0.25% of the BTC that they take in.
So, therefore, by definition, when illiquid supply ticks up it means coins are moving to entities that have a low probability to sell. Does that mean sometimes these entities can become liquid entities again? Yes, see May 2021, which was a leading indicator of the impending dump to 30k. But as with all forms of analysis, everything is based on probabilities.
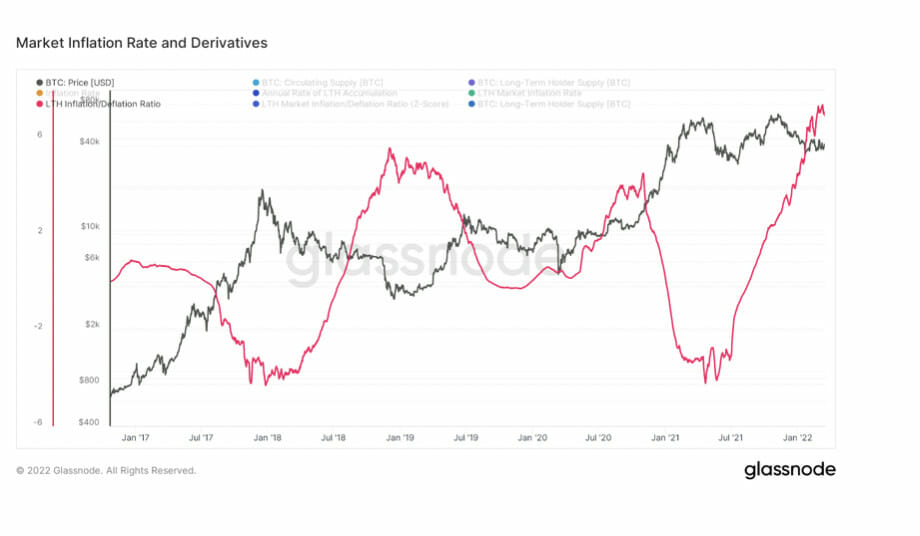
This shows when long-term holders’ supply is increasing, outpacing the rate of supply growth for BTC.
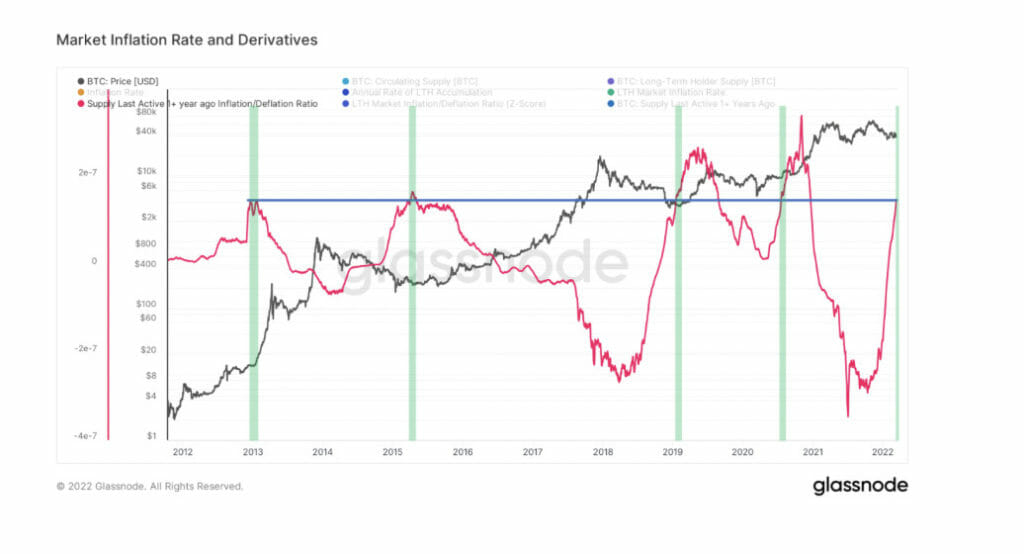
I took this methodology and used supply that hasn’t moved in at least a year instead of long term holder supply to create the metric below:
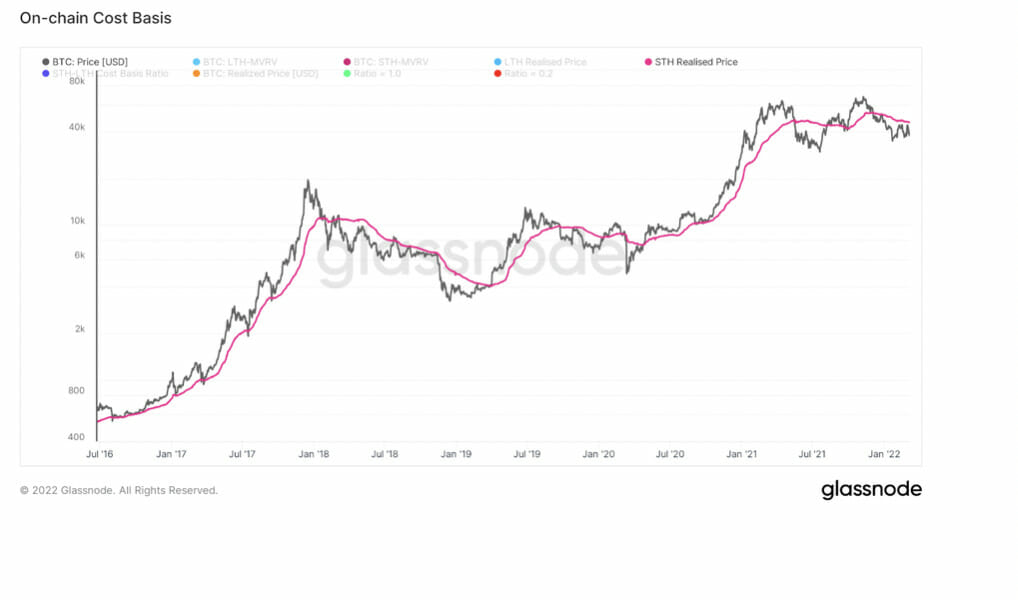
Ultimately, to regain the momentum I still look to short-term holder realized price as the level that BTC needs to reclaim to regain momentum.
This was the level we flipped cautious below which was at 53k at the time when BTC broke below. Currently sits right around $46k.
Closing Thoughts
The most important part of trading is discipline and patience. So, again, it’s your hard-earned money you’ll be investing, so Do Your Own Research before investing and nothing in this article is financial advice.
Also read,


