Bitcoin, the leading cryptocurrency by market capitalization, continues to trade near its all-time highs. Here’s an in-depth analysis covering BTC’s latest price, indicators, and news.
BTC is now positioned to potentially break its all-time highs if current market conditions persist, boosted by increasing institutional interest in BTC-focused ETFs and a favorable macroeconomic outlook.
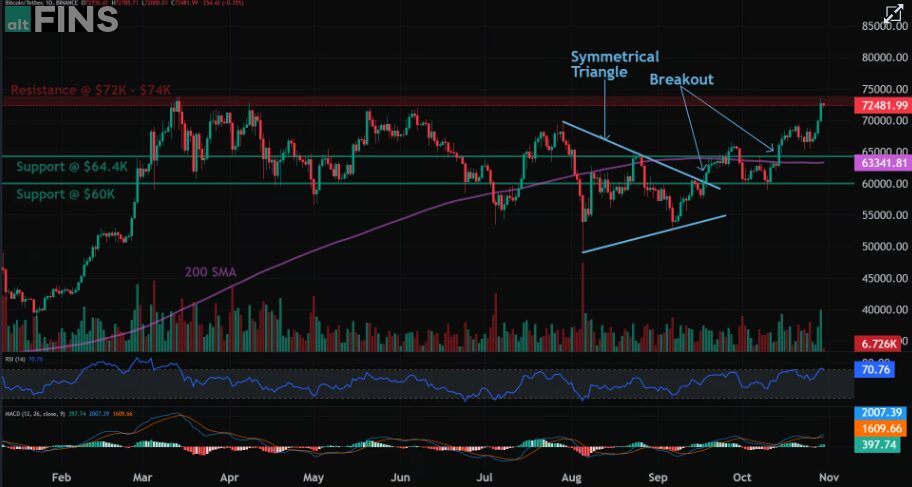
Price is Approaching Resistance, which is a level where it could pause or reverse its recent advance, at least temporarily. Resistance is often a level where price got rejected in the past, or potentially prior Support level that was broken. Once price breaks above resistance, it can advance higher to the next resistance level.
For on-demand analysis of any cryptocurrency, join our Telegram channel.
Bitcoin Next Target
- Current Price: $71,949.28
- Market Cap: $1.42 trillion
- 24h Trading Volume: $53.7 billion
- Circulating Supply: 19.76 million BTC
- Total Supply: 21 million BTC

Trends have reversed to Uptrend again after price price broke above $60K resistance and out of Symmetrical Triangle pattern, and it successfully retested that breakout level. It also broke through the $64.4K key level and 200-day moving average, and has reached $72K-$74K resistance zone.
Now we look for the right entry opportunity in Uptrend. We wait for price to either
1) break above $74K to signal continuation of uptrend, or
2) pull back near $64K support area for a swing trade entry in Uptrend with +15% upside back to $72K-$74K. Stop Loss at $58K.
Weekly Price Analysis
The momentum has been attributed to renewed interest from institutional investors, ETF inflows, and increasing confidence from the cryptocurrency community, all indicating potential for further gains.
Trend: Short-term trend is Strong Up, Medium-term trend is Strong Up, Long-term trend is Strong Up.
Momentum: Price is neither overbought nor oversold currently.
Support and Resistance: Nearest Support Zone is $56,500.00, then $50,000.00.
Key Indicators
- Moving Average (MA): Bitcoin’s 200-day moving average is now in a steady uptrend, which is a bullish signal.
- Relative Strength Index (RSI): Bitcoin’s RSI has risen to 70, entering overbought territory, which could indicate a short-term correction or a period of consolidation.
- MACD: The MACD indicator remains in positive territory, signaling continued bullish sentiment.
News Roundup
- ETF Inflows Surge: Bitcoin ETFs have seen consistent inflows, with U.S. ETFs contributing a net $22 billion in just nine months..
- Institutional Interest: High-profile investment firms, such as BlackRock, have also recently gained approval to offer options trading for Bitcoin ETFs.
- Macro Factors: Speculation around Federal Reserve policy changes has created a “risk-on” environment, which typically benefits BTC as investors look for higher-yielding assets.
For on-demand analysis of any cryptocurrency, join our Telegram channel.


