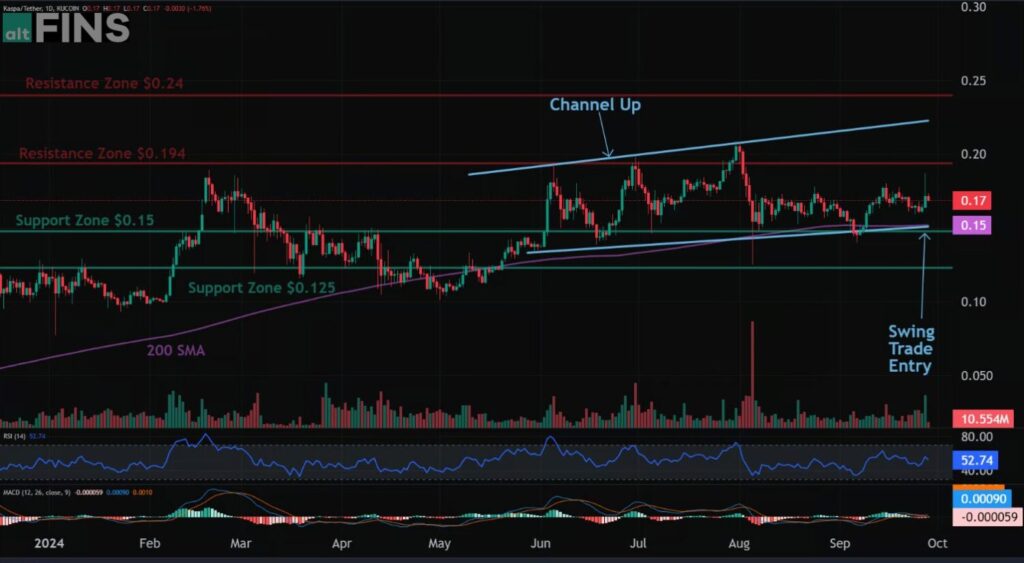
KAS Crypto’s price is trading in a Channel Up pattern, with a consistent upward trend driven by increased market interest in the coin’s unique Proof-of-Work (PoW) architecture.
With institutional interest growing and a unique emission schedule, KAS could be poised for further price appreciation as the crypto market matures.
For on-demand analysis of any cryptocurrency, join our Telegram channel.
KASPA Crypto Next Target
- Price: $0.174
- Market Cap: $3.27 billion
- 24h Trading Volume: $23.6 million
- Circulating Supply: 18.8 billion KAS
- Max Supply: 28.7 billion KAS

Remains in a long-term Uptrend, trading in a Channel Up pattern. We would be buyers on pullbacks to $0.15 support and 200-day moving average, which is a swing trade opportunity with +35% upside potential to $0.19. Stop Loss at $0.135.
Weekly Price Analysis
Over the last 7 days, Kaspa has experienced a 6.85% increase in value, with the week’s opening price at $0.162.
- 7-Day Price Change: +6.85%
- Week Open Price: $0.162
- Trend: Short-term trend is Up, Medium-term trend is Up, Long-term trend is Neutral.
- Momentum: Price is neither overbought nor oversold currently.
- Support and Resistance: Nearest Support Zone is $0.15, then $0.125. Nearest Resistance Zone is $0.194, then $0.24.
News Roundup
- Kaspa surpasses milestones: Kaspa continues to attract attention for its ability to scale without compromising security, thanks to its GHOSTDAG protocol. It recently celebrated achieving 1 block per second processing time and aims to push this further to 10 blocks per second in the coming months.
- Marathon Digital diversification: Marathon Digital announced mining $16 million worth of KAS, diversifying its operations beyond Bitcoin.
- Exponential growth: Kaspa has posted an impressive 2,113% average annual growth, ranking among the best-performing cryptocurrencies.
Technical Indicators
- Relative Strength Index (RSI): 64.2
- MACD (Moving Average Convergence Divergence): Bullish, with the MACD line above the signal line.
- Bollinger Bands: Widening bands suggest potential increased volatility, with the price hovering closer to the upper band.
For on-demand analysis of any cryptocurrency, join our Telegram channel.


