Dear readers, Hope all is well, and you had a great Christmas. Since it is the holiday season now, I won’t keep you too occupied.
I have come across two indicators that are signaling a bullish reversal trend. These two indicators are NVTS and SSR.
Bitcoin: Network Value to Transactiong Signal (NVTS)
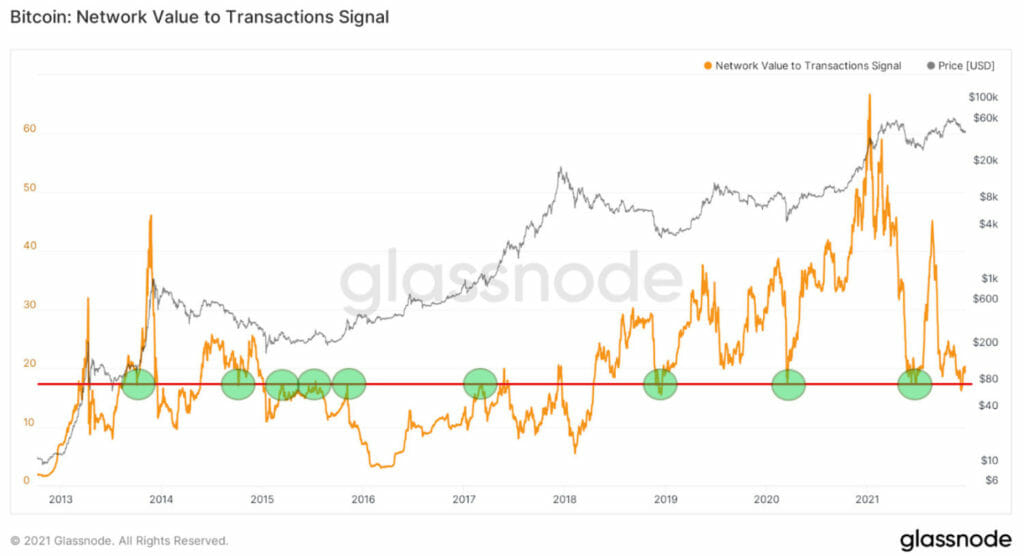
NVTS is an old but rather effective on-chain indicator. It has fallen in the ‘oversold’ area that has repeatedly acted as support for bitcoin. Moreover, NVTS falling in this area has been correlated with macro bottoms for bitcoin. NVTS are calculated by dividing market capitalization by transferred on-chain volume, measured in USD.
Further, it serves as a leading indicator since it uses a 90 day moving average of daily transaction volume in the denominator instead of raw daily transaction volume.
The long terms NVTS chart shows the area’s importance near the 17.5 value (red line) from which the indicator has jumped.
This area served as protection during the Summer 2021 Correlation, where BTC fell. It fell to the same level during COVID 19 crash in March 2020 and at the very bottom of the bear market in December 2018.

If NVTS is indeed currently giving a bullish signal and the Bitcoin Price correction were to end soon, we can expect an increase in BTC price.
Funds will need to flow in for this to happen from where potential purchases can be made.
Bitcoin: Stable Supply Ratio (SSR)
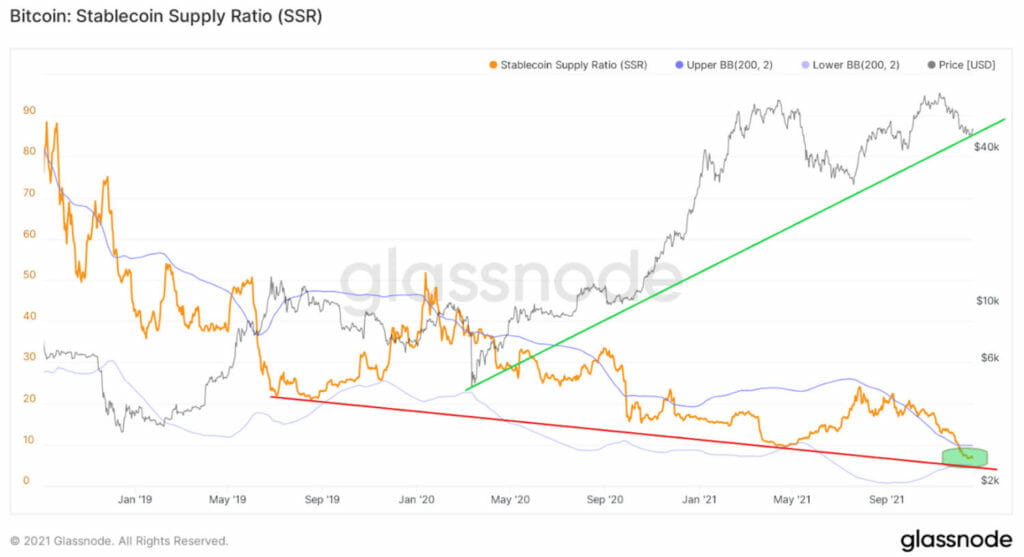
SSR measures the purchasing power of Stablecoin against BTC. Lately, it has reached an All-Time Low (Green Line), and the purchasing price of Stabelcoins has increased, hitting record highs.
Take notice of the following. Two non-ideal trend lines on the chart. The green uptrend line relates to the BTC Price, rising since the March 2020 bottom. The red downtrend line relates to the SSR and has been in place since July 2019.
Its decline signifies an increase in stable coin purchasing power. Periods of a substantial rise in stable coin purchasing power have historically coincided with clear corrections in the bitcoin price.

Conclusion
The two in-depth indicators analyzed and discussed strongly indicate in favor of the thesis that bitcoin is in the process of reaching the macro bottom.
When both indicators show their current values and are giving bullish signals, bitcoin’s price rose dynamically.
**Nothing in this article is financial advice, and you should only invest in the market you believe is suitable for your portfolio.


