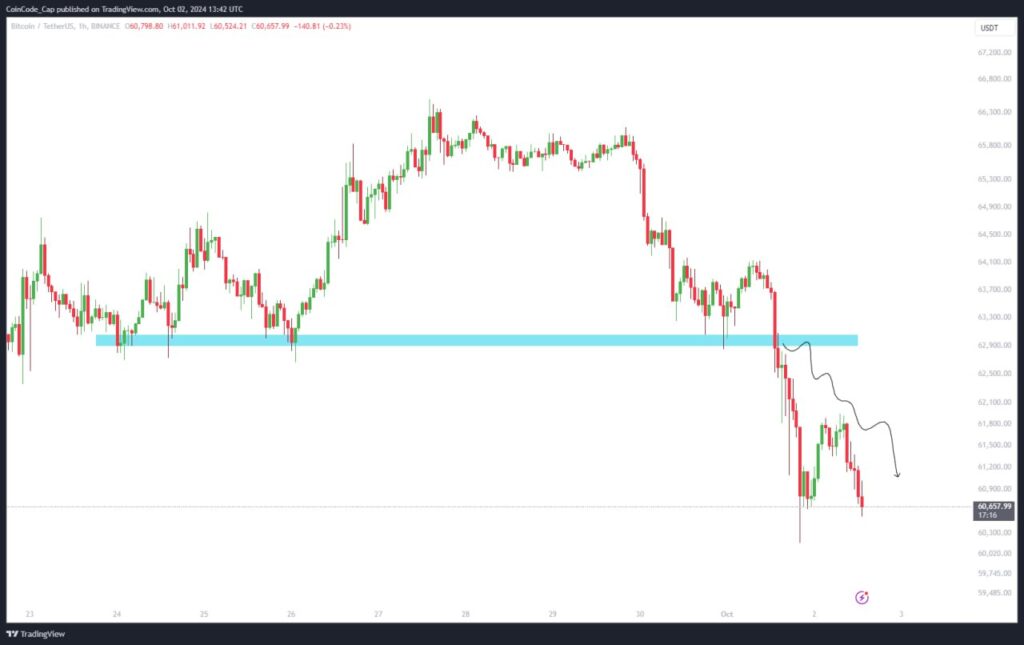
BTC has climbed back the charts and is now looking good for a buy. The price reflects a minor dip of -1.01% over the last 24 hours, but it still shows an increase compared to the previous month’s price.
In this article, we will look at Btc price analysis along with weekly price analysis and news roundup.
For on-demand analysis of any cryptocurrency, join our Telegram channel.
BTC Price Analysis
Bitcoin is trading at $61,797.12
- Market Cap: $1.20 trillion
- 24h Trading Volume: $23.5 billion
- Total Supply: 21 million BTC
- Circulating Supply: 19.5 million BTC

Perfectly went down as predicted 🤝
Weekly Price Analysis
Over the past week, Bitcoin’s price has declined by 2.19%, from $63,449.67 to $61,797.12.
- 7d Change: -2.19%
- Week Open Price: $63,449.67
Key Indicators
- RSI (Relative Strength Index): 48 (Neutral, with no strong buying or selling pressure)
- MACD (Moving Average Convergence Divergence): Mild bearish crossover
- Bollinger Bands: Price is approaching the lower band, indicating potential buying opportunities.
News Roundup
- Taiwan Approves Crypto ETFs for Professional Investors
- Institutional investment in Bitcoin is on the rise, with major firms accumulating during the recent dips
For on-demand analysis of any cryptocurrency, join our Telegram channel.


